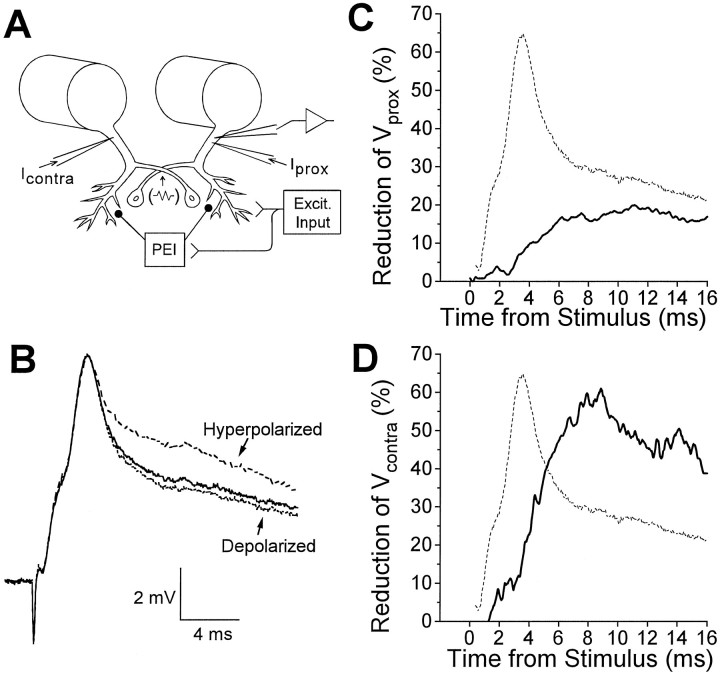
Fig. 4.
Shunting of currents injected into LG during the root-evoked PSP. A, Diagram of experimental setup: voltage measurements were obtained from one LG neuron;Vprox was produced byIprox, Vcontraby Icontra. PEI, Postexcitatory inhibition; Excit. Input, excitatory input. The commissural junction is represented by the resistor symbol at the point of overlap of the two LGs. B, Superimposed are root-evoked PSPs recorded at normal resting potential (middle trace), while the LG was hyperpolarized by 7.8 mV (top trace), and while it was depolarized by 0.9 mV (bottom trace). C, Mean percentage reduction of Vprox over the time course of the root-evoked PSP for one animal (solid curve).D, Mean percentage reduction ofVcontra over the time course of the root-evoked PSP for one animal (solid curve). In Cand D, the dashed curve represents the typical time course of the root-evoked PSP. Data in B,C, and D are from three different preparations.

