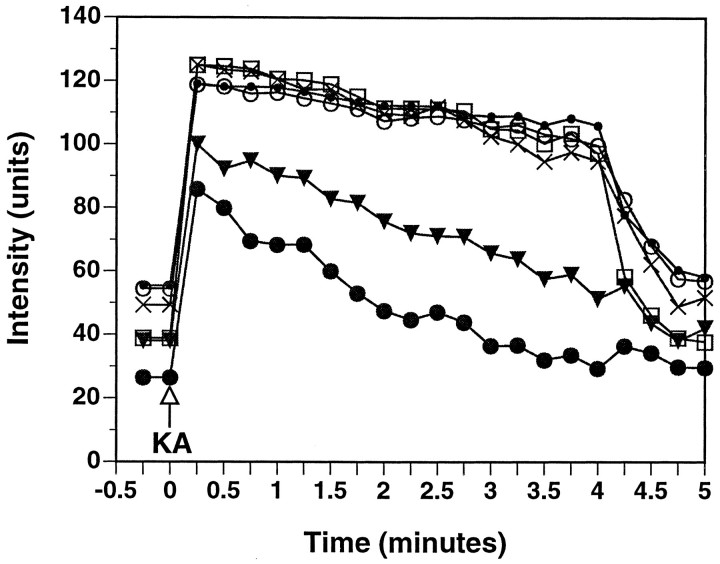
Fig. 10.
The results depicted in Figure9F–H are shown graphically. R123 intensity in six boutons (arrows in Fig. 9F) was quantified, background-subtracted, and plotted as a function of time. Application of kainic acid (KA) results in an immediate increase in R123 fluorescence, consistent with a loss of mitochondrial potential; however, as exposure to KA continues, R123 intensity decreases with eventual loss of the dye.

