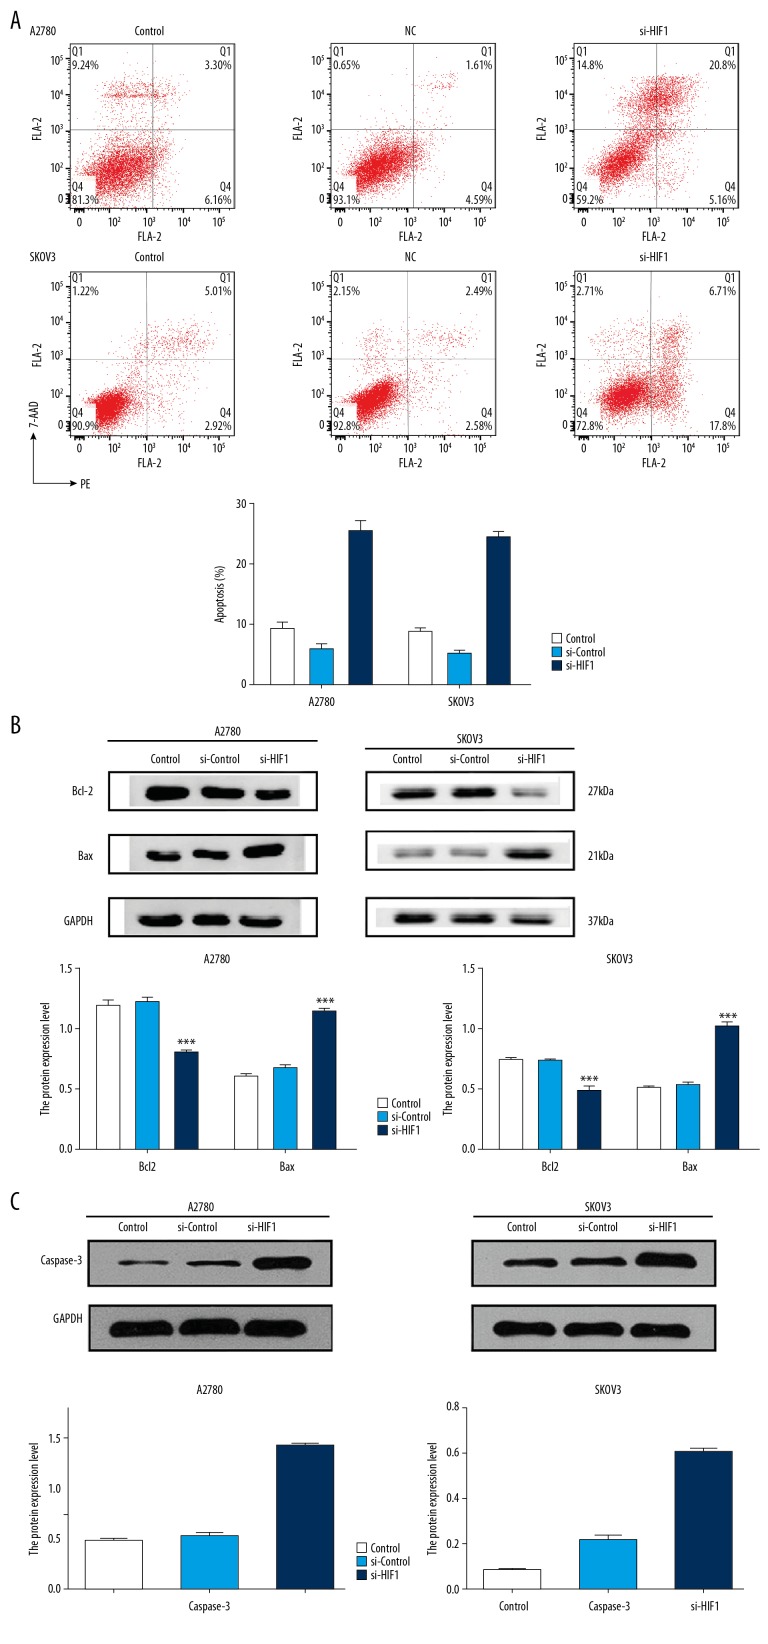
Figure 4.
Knockdown of HIF-1α promoted apoptosis in ovarian cancer cells. (A) The transfected cells and control cells were assayed for apoptosis by V/PI staining. Four quadrants in the image referred to different cells. LL – lower left quadrant refereed to the living cells. LR – lower right quadrant refereed to the early apoptosis cells. UR – right upper quadrant refereed to the late apoptosis cells. UL – left upper quadrant referred to the necrotic cells. Therefore, the total apoptosis rate was LR+UR. The data were presented as the means ±SD from at least 3 independent experiments. (B) Bax proteins was upregulated, and bcl-2 protein was downregulated after transfection. (* p<0.05; ** p<0.01; *** p<0.001 by the Kruskal-Wallis test). (C) Caspase-3 proteins was upregulated after transfection in A2710 and SKOV3 cells (* p<0.05; ** p<0.01; *** p<0.001 by the Kruskal-Wallis test).

