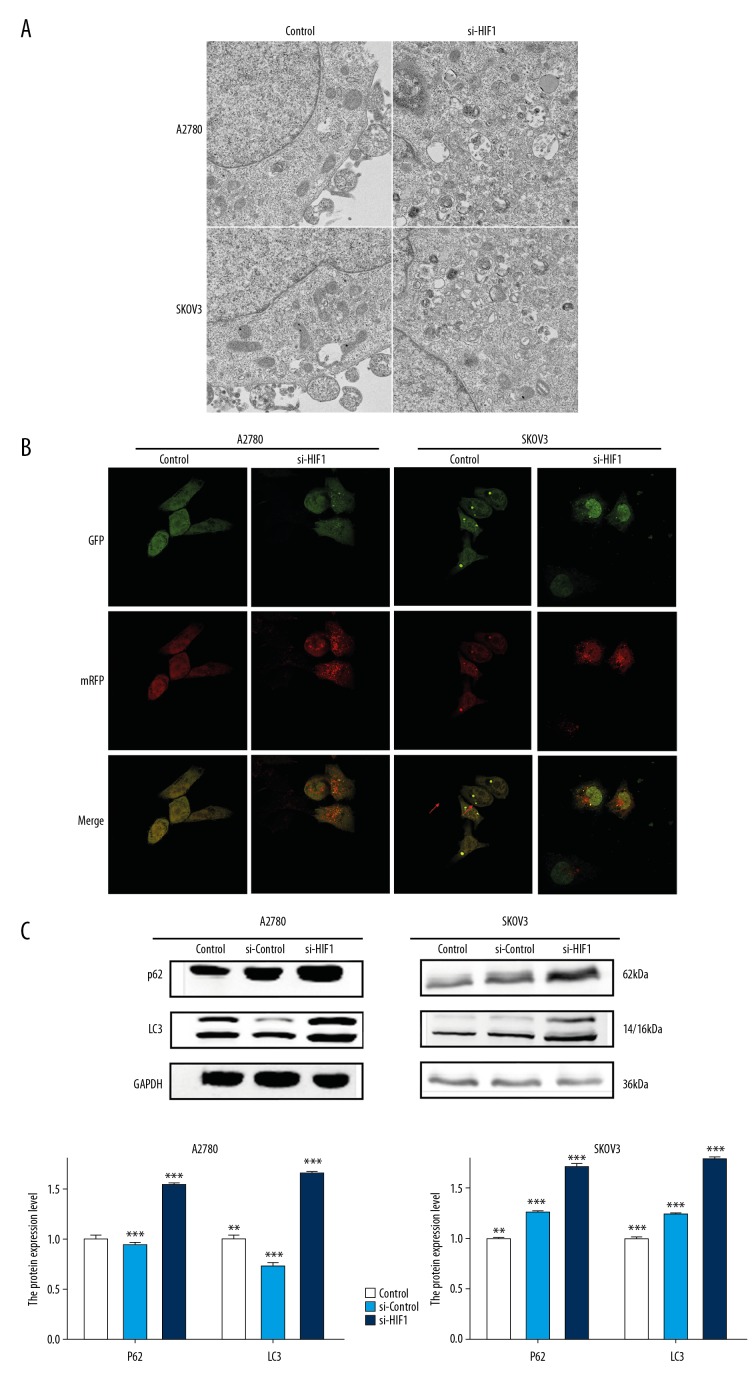
Figure 5.
Autophagy detection in A2780 and SKOV3 cells. (A) Representative images of transmission electron microscopy performed on A2780 and SKOV3 cells receiving HIF-1α siRNA transfection treatment as described in the Materials and Methods section. The red arrows point to autophagosomes. (B) Detection of Mrfp-GFP-LC3 puncta indicative of autophagy in ovarian cancer cells transfected with scrambled control siRNA or HIF-1α-specific siRNA. Photographs were taken at 1600×. In the merged picture, the yellow dots represent the level of autophagosomes and the red dots represent the level of autolysosomes. (C) Autophagy-associated proteins P62 and LC3 were detected by Western blot. Total protein levels were normalized to GAPDH levels. Data are presented as the means ±SD from at least 3 independent experiments (* p<0.05; ** p<0.01; *** p<0.001 by Kruskal-Wallis test).

