
Fig. 2.
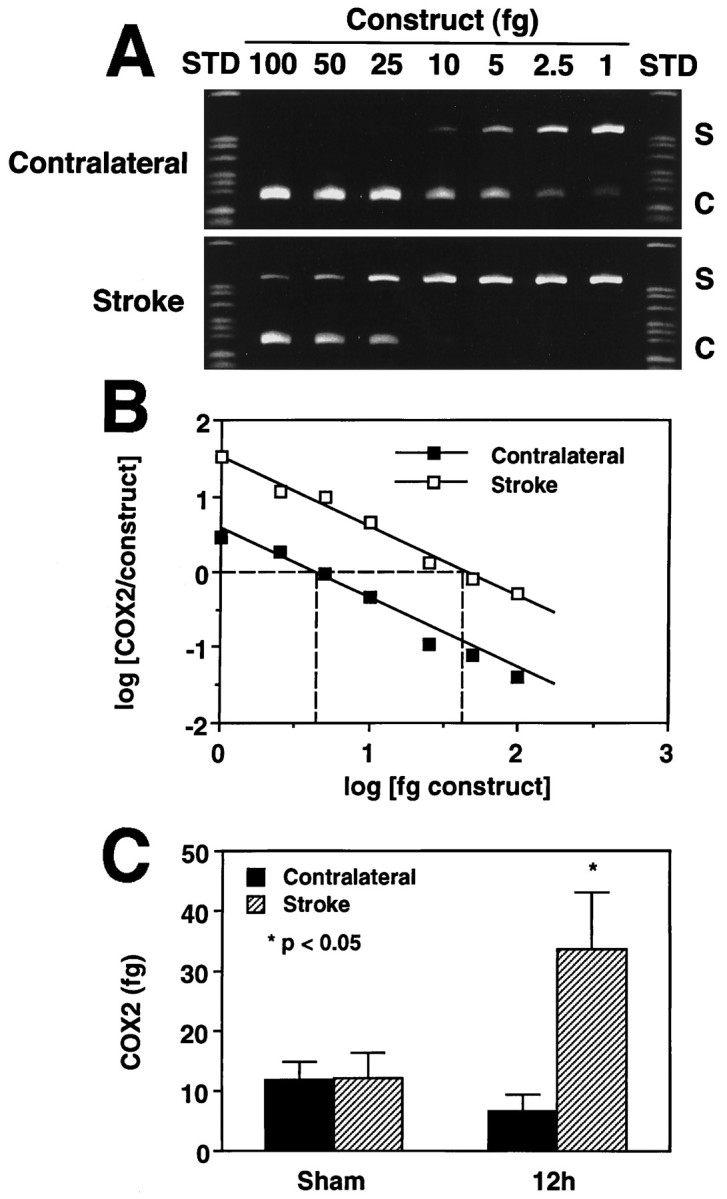
Competitive PCR to quantify the magnitude of COX-2 expression after cerebral ischemia. Samples were obtained from animals killed 12 hr after stroke. A, Competition between the COX-2 PCR product (S) and increasing amounts of a construct (C) produced by deletion of an internal portion of the COX-2 PCR product. Notice that a higher amount of construct is needed to compete out the COX-2 PCR product on the stroke side than on the contralateral side. B, Quantitative analysis of the gel presented in A. The log of the ratio of the density (COX-2/construct) was plotted as a function of the log of the concentration of the construct and fitted by linear regression analysis. The 0 value of the log of the ratio (COX-2/construct) (y-axis) represents the point at which the COX-2 PCR product and construct are present in equal amounts. Therefore, the amount of the construct corresponding to the 0 ratio (x-axis) corresponds to the amount of the COX-2 PCR product before PCR amplification. C, Group data on COX-2 expression in sham-operated rats and in rats 12 hr after transient MCA occlusion. In sham-operated rats (n = 4), COX-2 does not differ between sides. After ischemia (n = 4), there is a marked increase in the COX-2 PCR product.