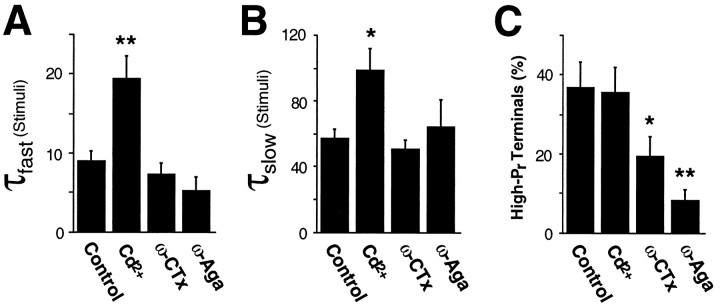
Fig. 4.
Summary of the progressive block experiments shown in Figures 1, 2, 3. Error bars represent mean ± SEM;stars indicate a statistically significant difference from control (one star, p < 0.05;two stars, p < 0.02). The progressive block time constants are increased by Cd2+ but are unaffected by the toxins (A, B). The percentage of high Pr terminals is unaffected by Cd2+ but is reduced by the toxins (C), implying that the toxins cause a population shift from high Pr to lowPr terminals.

