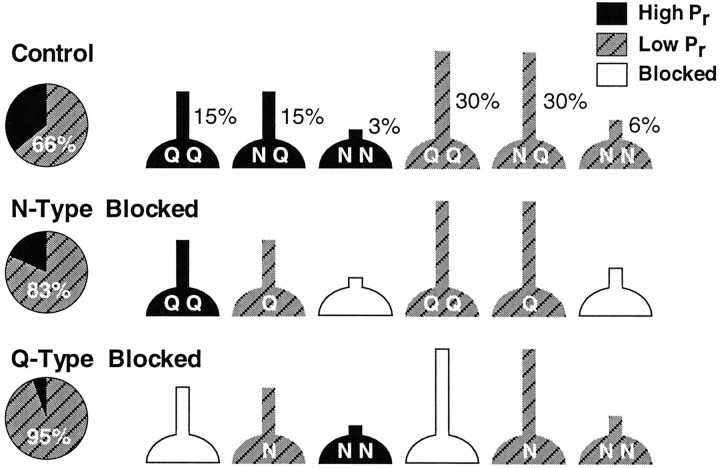
Fig. 6.
A simple model of a nonuniform distribution of presynaptic Ca2+ channel subtypes accounts for our data. Presynaptic terminals are assumed to be either highPr or low Pr and to contain only P/Q-type Ca2+ channels (QQ), only N-type (NN), or a mixture of the two (NQ) in the same relative proportions for both high and low Pr sites. When N-type channels are blocked by adding ω-CTx GVIA, NN-type terminals are blocked completely, QQ-type terminals are unaltered, andNQ-type terminals have theirPr either reduced or unaffected, depending on the initial Pr. A similar argument applies to the block of P/Q-type channels by ω-Aga. For further details, see Discussion. The percentages shownabove the control terminals are the estimated relative number of terminals in each category when the model was optimized to fit our data (Table 1). The pie graphs give the percentages of functional high and low Prterminals in each condition.

