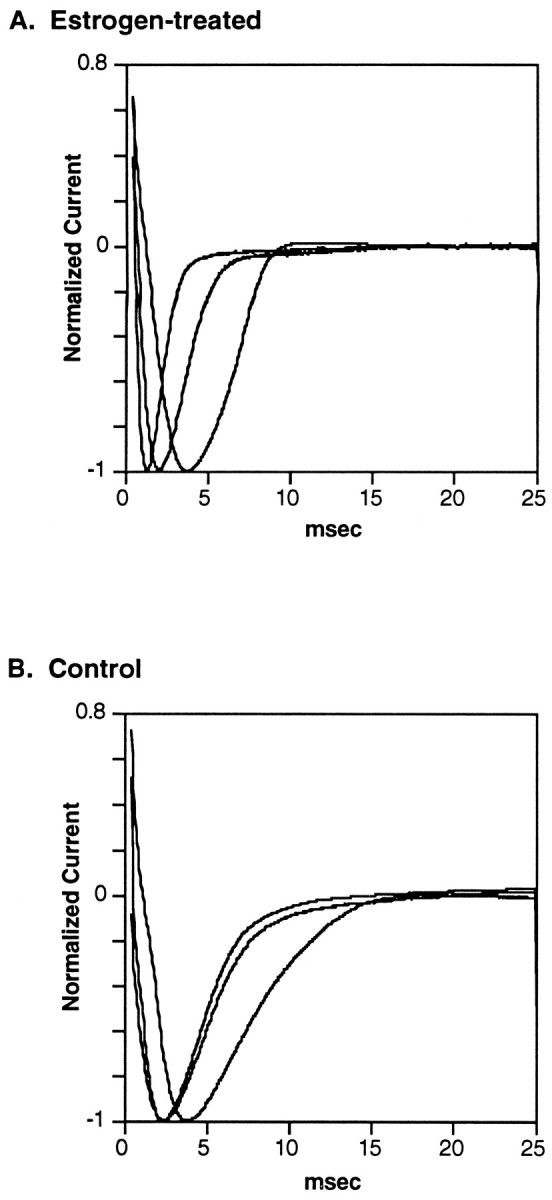
Fig. 2.

Representative voltage-clamp traces of the peak electrocyte sodium current from (A) three fish implanted with E2-filled capsules and (B) three control fish implanted with empty capsules. Holding potential ranged from −73 to −100 mV. The membrane potential was stepped in 5 mV increments from 40 mV below holding potential to 180 mV above. Maximum sodium current amplitude was normalized to −1.0. Inactivation time constants (tau) in milliseconds for fish in this figure were 0.710, 0.635, and 1.206 for estrogen-treated fish and 2.209, 2.395, and 3.900 for control fish.
