
Fig. 3.
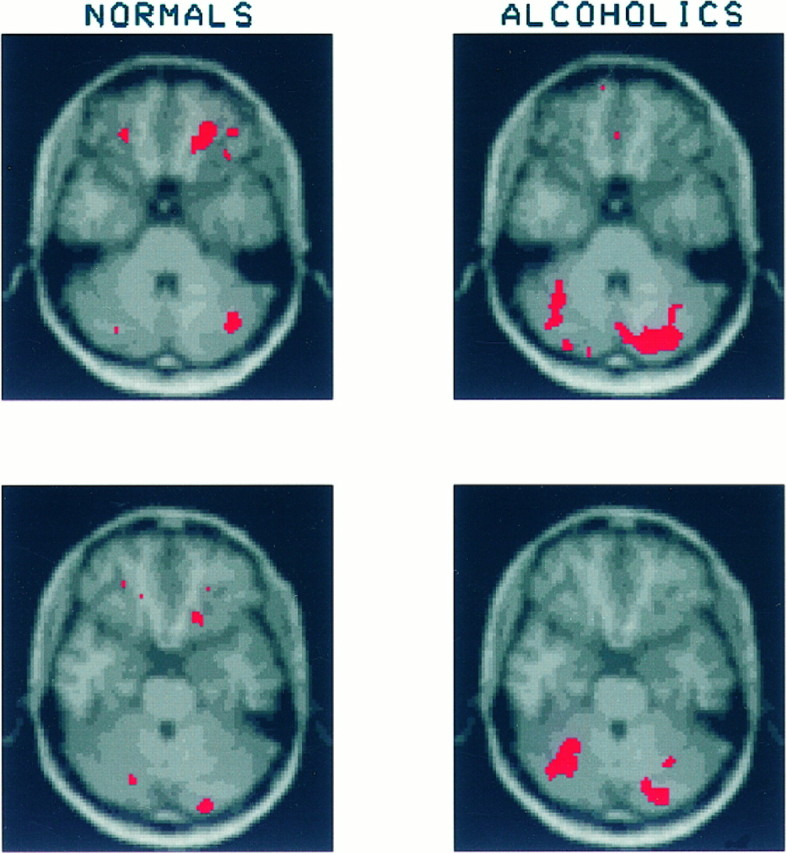
Each of the Figures 3, 4, 5, 6, 7, 8 displays two pairs of contiguous axial slices from an MRI image of the brain of the healthy subject, which was used as a template onto which each subject’s PET data were transformed. These slices correspond to the original PET slices collected parallel to the cantho-meatal lines and separated by 3.6 mm. Superimposed in red on these MRI images are the regions that showed a significant increase in CMRglc after mCPP administration. The brain response of healthy volunteers is shown on the left and that of alcoholics on theright. To compare the magnitude of the regional mCPP response between alcoholics and healthy volunteers, we summed regions of significantly activated contiguous pixels (both within a slice and across adjacent slices) and calculated the mean CMRglc before and after mCPP. From these values we determined a percentage increase in glucose utilization after mCPP. The volume of significant increase was determined by using the subject group (alcoholics or healthy volunteers) that showed the largest volume of significant activation for each brain region examined. In most brain regions the healthy volunteers had larger volumes of significant increase than the alcoholics, exceptions being the right and left cerebellum and the left posterior cingulate. No statistical comparison is made using these values because they are derived from a post hoc analysis of data already examined for statistical significance by the Gaussian random field method. Figure 3 shows two contiguous slices through the orbital cortex. Among the healthy volunteers an area of significantly increased glucose utilization after mCPP can be seen in the right orbital cortex of both slices. The mean increase in CMRglc in significantly activated right orbital cortex was 27.6 ± 20.1% (mean ± SD). Among alcoholics this same region showed a mean increase of 7.5 ± 11.7%. A different pattern occurs in the cerebellum, where alcoholics show a larger extent of significantly increased CMRglc. In the right cerebellum alcoholics increased glucose utilization by 16.3 ± 9.9%, whereas healthy volunteers increased by 15.8 ± 17.2%. In the left cerebellum alcoholics increased by 16.7 ± 11.1%, and healthy volunteers increased by 13.1 ± 17.9%.