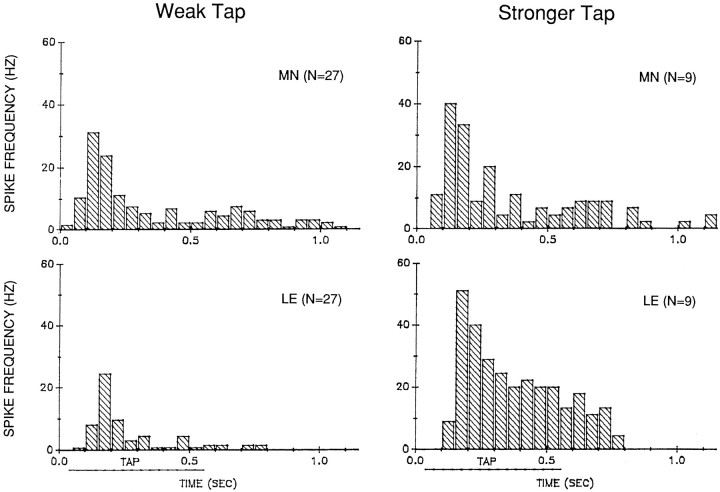
Fig. 6.
Average pattern of firing in an LE neuron (LE) and a motor neuron (MN) in response to controlled-force stimulation of the siphon of weak (2.8–7.8 gm/mm2) or stronger (9.7–23.0 gm/mm2) intensity. The average spike frequency in each 50 msec interval was calculated as the total number of spikes in that interval divided by (0.05 × N). Time 0.0 is the start of the tap. The approximate duration of the plateau of the tap is indicated by the horizontal line below thex-axis. Rested preparations were tested with a weak tap; some of those preparations were then retested with stronger taps.

