
Fig. 7.
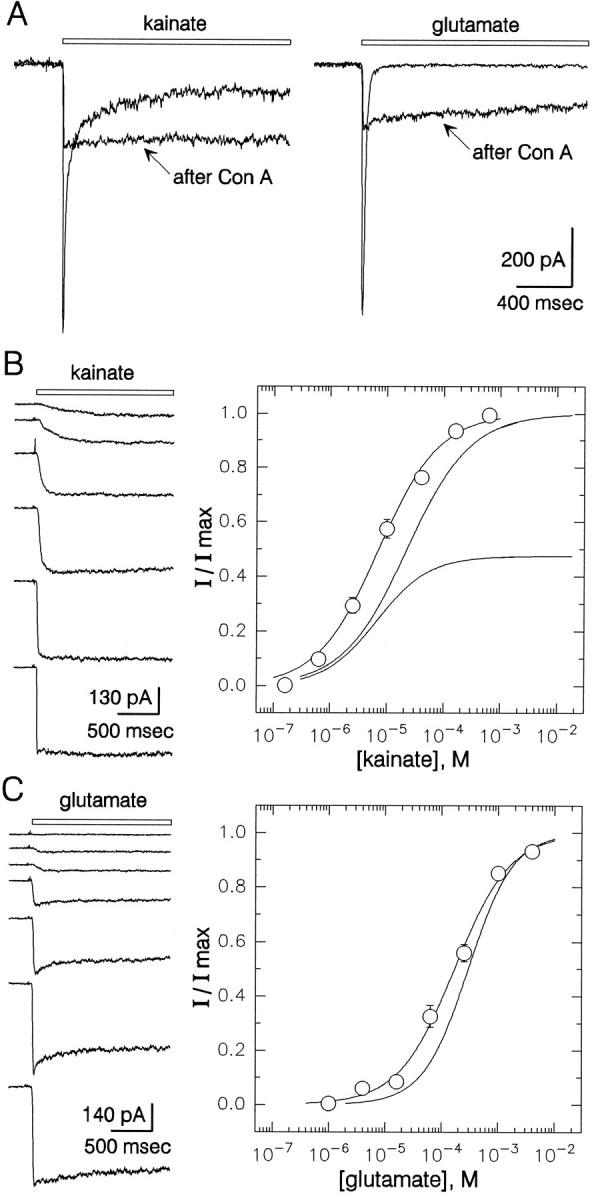
Action of Con A on hippocampal kainate receptors.A, Currents evoked by 300 μm kainate before and after exposure to Con A are shown superimposed (left); also shown are currents evoked in a different cell by 1 mm glutamate (right).B, Currents evoked by 0.63, 2.5, 10, 40, 160, and 630 μm kainate in a cell exposed to Con A. Normalized current in 12–16 cells that had been exposed to Con A is plotted as a function of kainate concentration. EC50 = 7 μm (95% CI, 6–8 μm), n = 0.8 ± 0.1.Smooth curves for peak and steady-state kainate current from Figure 5 are shown for comparison. C, Currents elicited by 1, 4, 16, 63, and 250 μm and 1 and 4 mm glutamate in a cell exposed to Con A. Normalized peak current is plotted as a function of glutamate concentration; 5–17 cells were tested at each concentration. EC50 = 168 μm (95% CI, 129–218 μm),n = 0.9 ± 0.1. The smooth curve for peak current before Con A exposure from Figure 5 is shown for comparison. All traces were recorded in the continuous presence of 100 μm GYKI.