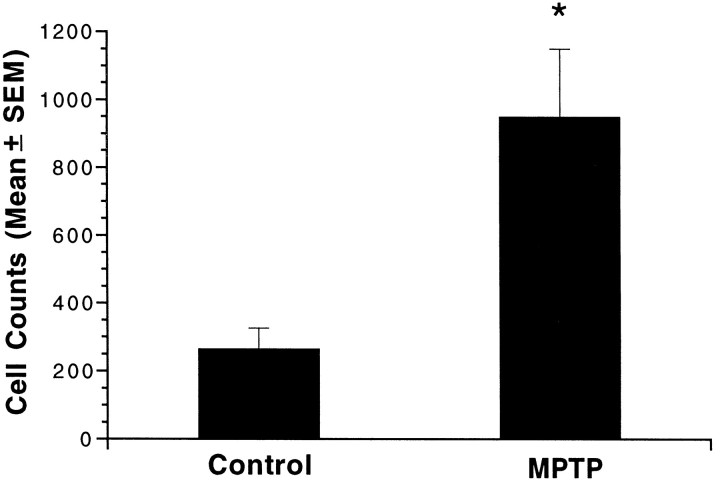
Fig. 3.
TH-immunoreactive cell counts in the striatum of control and MPTP-treated monkeys. Bars represent the mean ± SE total cell counts from four anatomically matched sections of striatum from each of three control and four MPTP-treated monkeys. Cell counts in MPTP-treated monkeys were 3.5-fold greater than in control monkeys (*p < 0.05).

