Fig. 3.
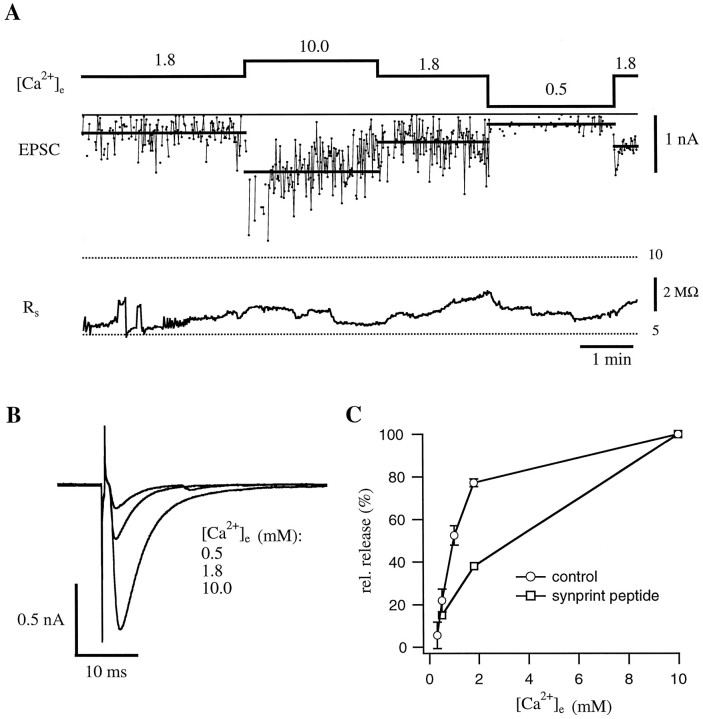
Representative experiment on a synapse that contained the synprint peptide. A, EPSCs resulting from stimulation of the nerve cell at 1 Hz. The top traceshows the different external calcium concentration [Ca2+]e (in mm); thebottom trace shows the series resistance on the muscle cell (Rs) during the experiment.B, Examples of averaged EPSCs at the indicated external calcium concentrations. C, Comparison of the dependence of relative synaptic transmission on [Ca2+]e for control cells and cells that contained the synprint peptide. For control cells, averaged data from 14 cells are displayed (for details, see Table 1). The curve for the synprint peptide is derived from the data shown in A(for averaged data of peptide-injected cells, see Fig.5B and Table 1). Error bars represent SEM. Note the decrease in relative transmitter release under physiological [Ca2+]e for the peptide-injected cell.

