
Fig. 4.
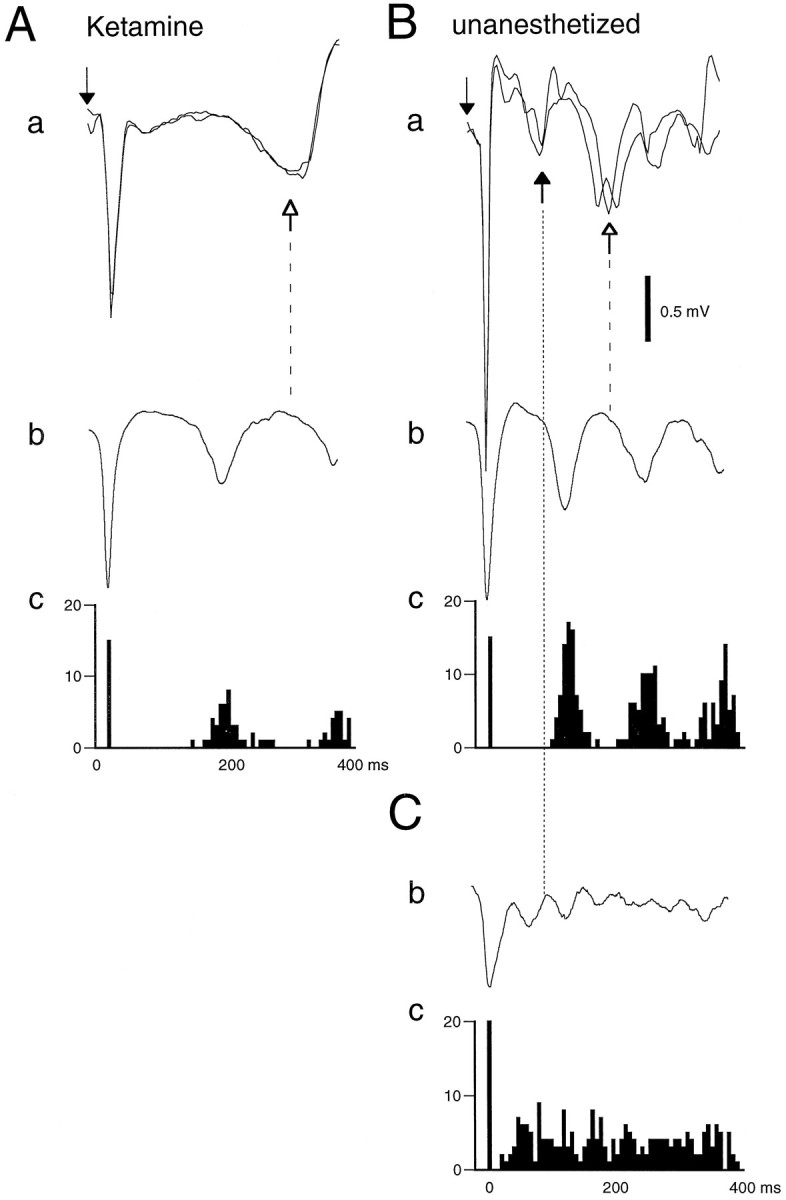
Relationship between thalamic stimulation-induced late potential and HVSs and sleep spindles in the anesthetized (Ketamine) and awake rat. A,a, Two superimposed averages (n = 8) of VPL-evoked responses. Open arrow with dashed line, late potential. b, Averaged HVSs (n = 50). c, Interval histogram of the spike components of HVSs. Note that the average interspike interval is shorter than the latency of peak negativity of the late potential.B, a–c, Same rat used inA analyzed under the same conditions in the unanesthetized state. a, Black andopen arrows with dotted and dashed lines; Late potentials at ∼ 100 and 200 msec, respectively. Note that in the unanesthetized animal both the interspike interval and the latency of the late potential (200 msec) were shorter. C, Averaged sleep spindle (b) and interpeak interval histogram (c) of the sleep spindles. Note that the interpeak interval is shorter than the latency of the first late potential (100 msec). Downward arrows, Thalamic stimulus.