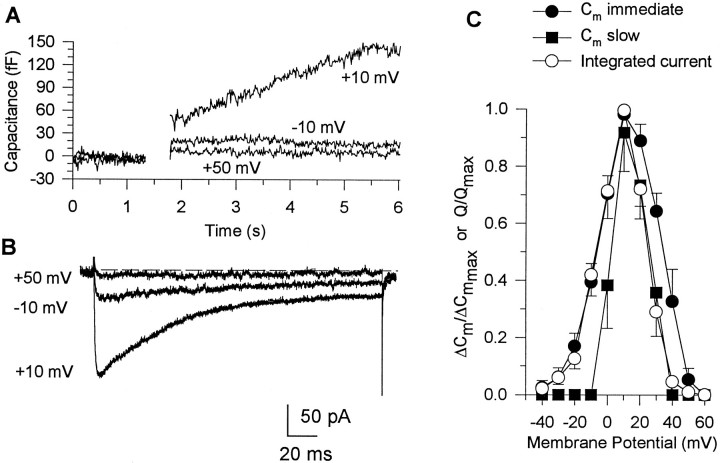
Fig. 3.
Comparison of current–voltage and ΔCm–voltage relationships determined for single nerve endings. Cm responses (A) and corresponding Ca2+currents (B) evoked in a single terminal by 200 msec step depolarizations to different command potentials (shown near corresponding traces) from a holding potential of −90 mV. The depolarizations to −10 and +50 mV produced small currents that were accompanied by an immediate, step-likeCm increase, whereas steps to +10 mV evoked a larger current and prolonged Cm increase lasting for several seconds. Ca2+-dependentCm responses were corrected for transient ΔCm artifacts (as explained in text) by subtracting the response to a 5 msec depolarization aligned with the pulse. C. Integrated Ca2+ currents (open circles; n = 8) and corresponding immediate (filled circles;n = 8) and slow (filled squares; n = 6)Cm responses plotted against command potential at which they were evoked.

