
Fig. 2.
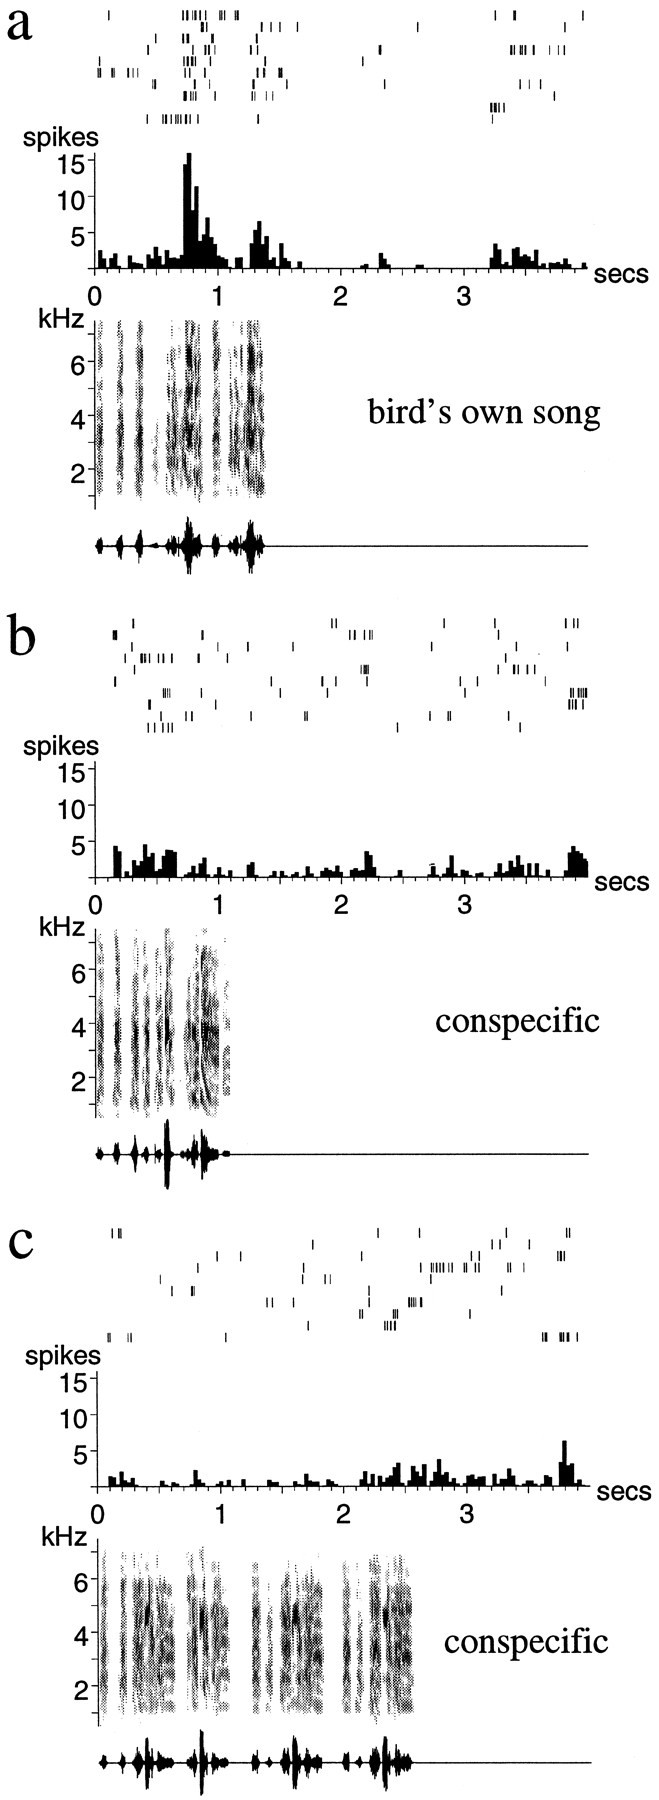
Auditory responses of a single unit in LMAN of an adult zebra finch. a, The response to the BOS;b, c, responses to two different conspecific songs (songs of other individual zebra finches). The strong response to the BOS is followed by a period (∼1.5 sec) of inhibition. Note that there is considerable trial-to-trial variability in the reproducibility and exact timing of the stimulus-evoked spikes. The conspecific song in b elicits a weak response, whereas the song in c inhibits the spontaneous firing of the neuron. Below each spike raster and peristimulus time histogram are shown the sonogram (frequency vs time plot, with energy in each frequency band indicated by the darkness of the signal) and the oscillogram (amplitude waveform) of the song stimulus used.