
Fig. 4.
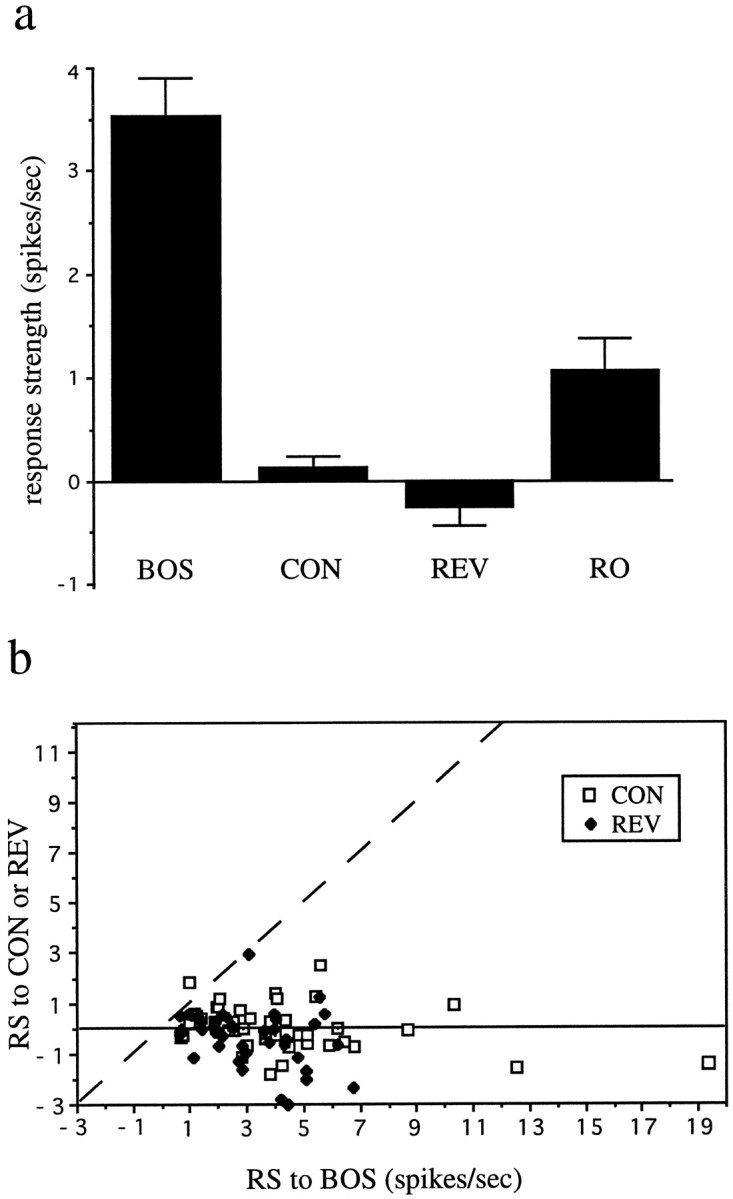
Summary data for adult LMAN neurons.a, Histogram of mean of RS values of all LMAN neurons recorded to the BOS, conspecific song (CON), BOS reversed (REV), and BOS in reverse order (RO). Error bars indicates SEM. b, For each individual LMAN unit for which these stimuli were tested, the RS values (RS) to the BOS is plotted versus the RS to CON (open squares) or the RS to REV (solid diamonds). The dashed line indicates the points where responses to the stimuli plotted on each axis are equal.