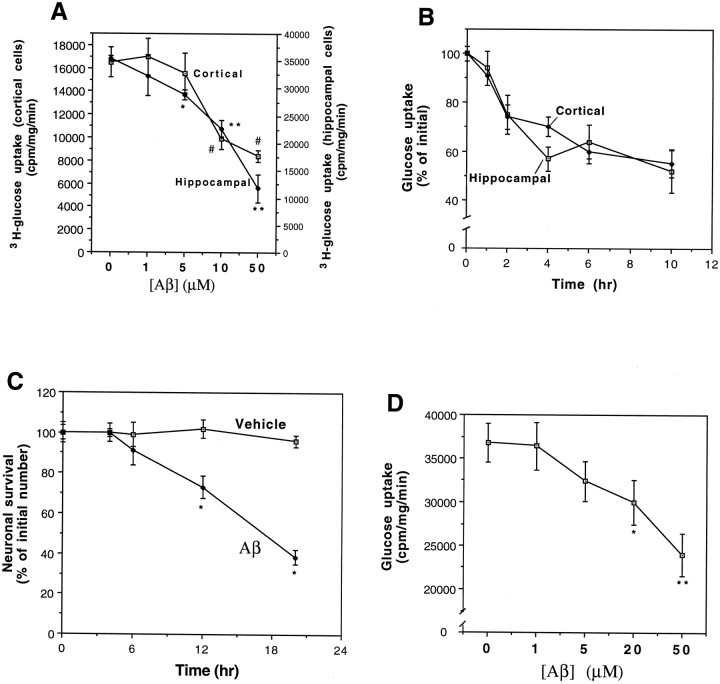
Fig. 1.
Aβ induces a concentration-dependent decrease in glucose uptake in hippocampal and cortical cell cultures with a time course that precedes cell death. A, Neocortical and hippocampal cell cultures were exposed for 2 hr to vehicle or the indicated concentrations of Aβ25-35, and cellular uptake of [3H]-glucose uptake was quantified. Values are the mean and SD of determinations made in six separate cultures. *p < 0.01, **p < 0.001 for hippocampal cultures; #p < 0.01 for cortical cultures, compared to cultures exposed to vehicle (0 [Aβ]).B, Cortical and hippocampal cultures were exposed to 10 μm Aβ25-35 for the indicated time periods, and [3H]-glucose uptake was quantified. Values represent the mean and SD of determinations made in four to seven separate cultures. The decrease in glucose uptake was significant for both cortical and hippocampal cultures at the 2 hr (p < 0.05), and 4, 6, and 10 hr (p < 0.01) time points. ANOVA with Scheffe’s post hoc tests.C, Hippocampal cultures were exposed to vehicle or 10 μm Aβ25-35 for the indicated time periods, and neuronal survival was quantified (see Materials and Methods). Values represent the mean and SD of five separate cultures. *p < 0.005 (ANOVA with Scheffe’s post hoc test).D, Hippocampal cultures were exposed for 6 hr to Aβ1-40 at the indicated concentrations, and [3H]-glucose uptake was quantified. Values represent the mean and SD of determinations made in four separate cultures. *p < 0.05, **p < 0.001 compared to control (0 Aβ) value. ANOVA with Scheffe’s post hoc analysis.

