Fig. 3.

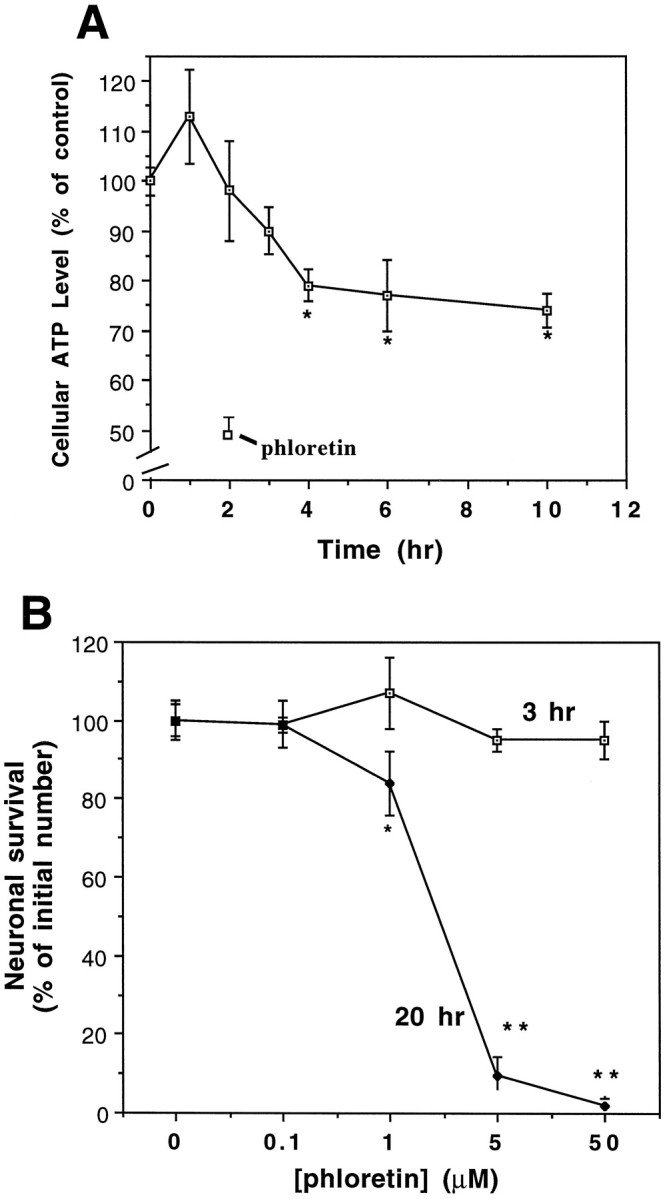
A, Aβ induces a decrease in cellular ATP levels with a time course that follows impairment of glucose uptake. Neocortical cultures were exposed to 10 μm Aβ25-35 for the indicated time periods and intracellular ATP levels were quantified (see Materials and Methods). Additional cultures were exposed to 5 μm phloretin for 2 hr. Values are expressed as percentage of the value in untreated control cultures and represent the mean and SD of determinations made in 5–15 separate cultures. *p < 0.05 compared to control cultures; ANOVA with Fischer’s post hocanalysis. The level of ATP in untreated control cultures was 29.2 ± 0.98 nmol ATP/mg protein. B, Phloretin induces a time- and concentration-dependent decrease in neuronal survival. Hippocampal cultures were exposed to the indicated concentrations of phloretin, and neuronal survival was determined 3 and 20 hr later. Values represent the mean and SD from five separate cultures. *p < 0.01, **p < 0.001 as compared to control cultures. ANOVA with Scheffe’s post hoc analysis.
