Fig. 4.
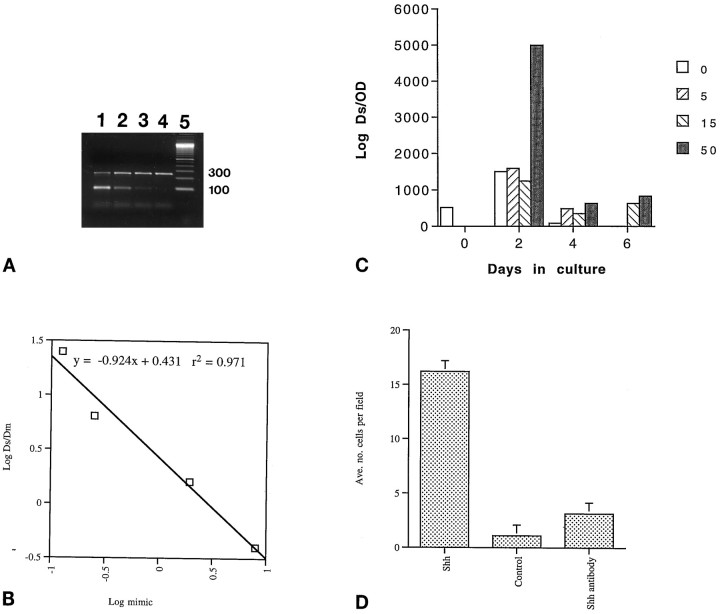
Specificity of Shh activity. A, QC-PCR gel. Lanes 1–4 are cDNA from midbrain cultures that have been coamplified with successive fourfold dilutions of mimic oligo. Lane 5 is DNA marker lane. Ptctarget is 254 bp and mimic is 100 bp. B, Representative plot (corresponding to A) of the log concentration of competitive mimic versus the log of the obtained band densities of target and mimic PCR substrates demonstrates the linearity of the amplification reaction. The extrapolated value of ptcmessage in the cDNA tested is determined to be equal to the value of mimic concentration where LogDs/Dm = 0. See main text for details of the procedure. Doses in ng/ml;Ds = density of test substrate;Dm = density of competitive mimic. Ther2 value shows that determinations made within this range vary within 3%. C, Administration of Shh induces ptc expression in a dose– response that parallels the survival curve. The values are expressed as number of target molecules (Log Ds) per total amount of cDNA used in each reaction as measured by optical density at 260 nm (OD) and were determined as demonstrated in A and B. At 4 din vitro Shh at 5 ng/ml increases ptcexpression over control, and 50 ng/ml increases expression ofptc over the level found in the ventral mesencephalon at the time of dissection. D, Affinity-purified anti-Shh antibody inhibited the Shh neurotrophic response (p < 0.001). Cultures were maintained for 5 d. Shh was added at a concentration of 50 ng/ml, and in the coadministration of Shh and anti-Shh (“Shh antibody”) Shh was added at 50 ng/ml and anti-Shh was added as a fivefold molar excess (error bars represent SEM).

