
Fig. 1.
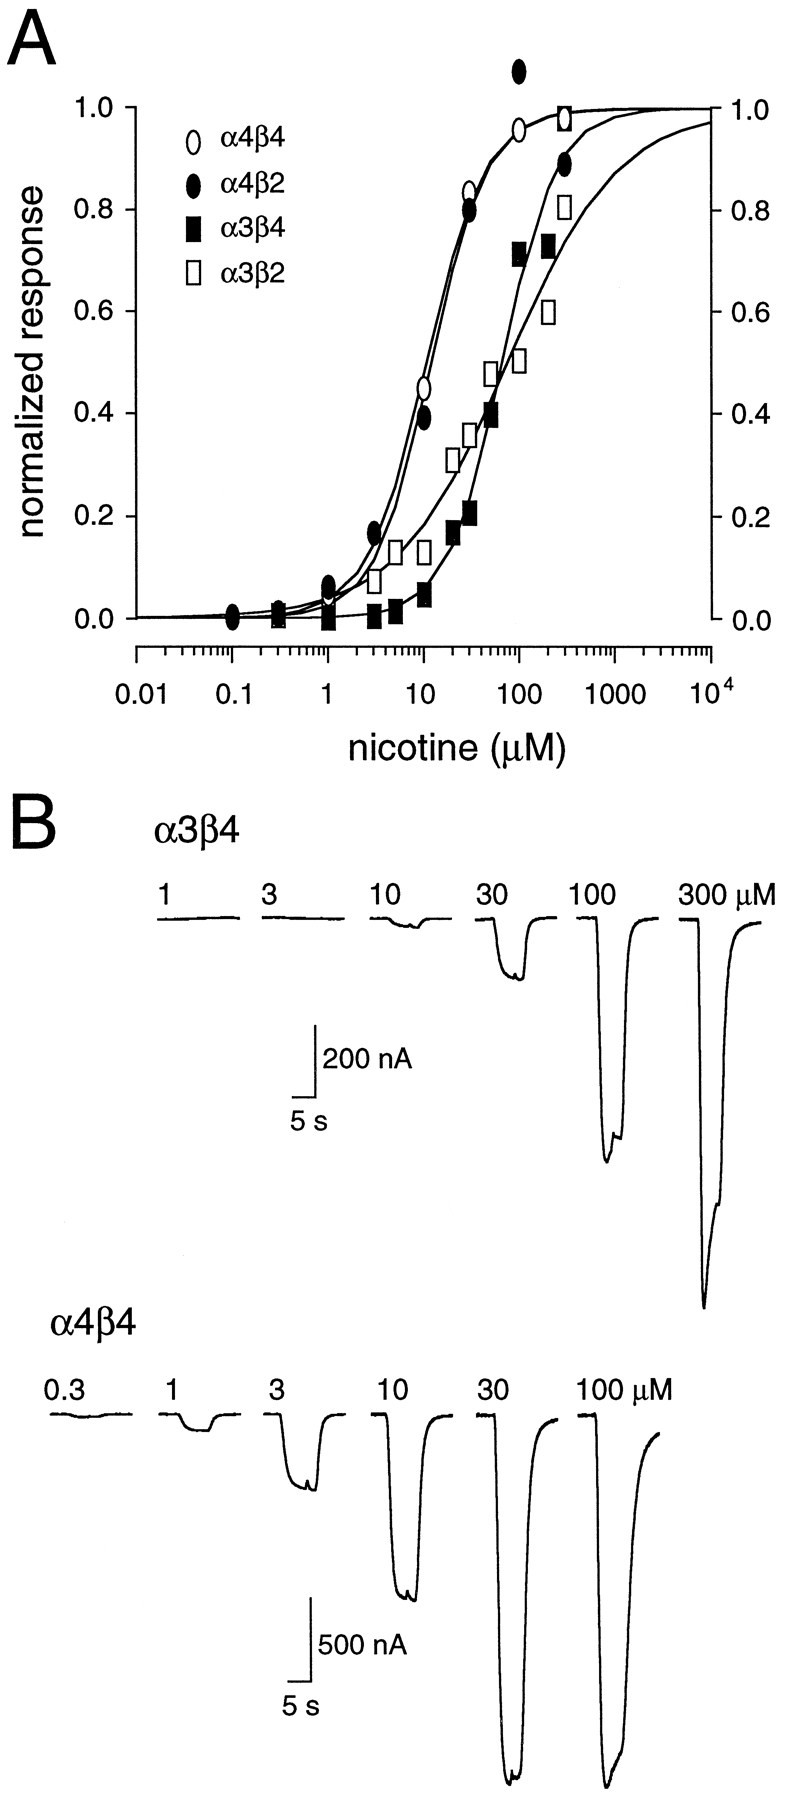
α4 subunits confer high apparent affinity on nAChRs. A, Concentration–response curves were constructed by measuring the peak current induced in response to brief (5–10 sec) applications of nicotine (100 nm–300 μm). The peak responses are plotted with respect to agonist concentration for four subtypes of nAChRs (α3β4, α3β2, α4β4, andα4β2). For each subtype all responses were normalized to a response near the half-maximal concentration (EC50). Each point represents one to eight separate measurements. The solid lines are logistic fits to the data. The calculated EC50 values and the Hill coefficients were, respectively, 65 μm and 1.5 (α3β4), 75 μm and 0.7 (α3β2), 11 μm and 1.4 (α4β4), and 12 μm and 1.5 (α4β2). B, Representative current responses for a series of nicotine concentrations applied to two different oocytes expressing either α3β4 receptors (top traces) or α4β4 receptors (bottom traces). All data shown in this figure were obtained in calcium-free conditions.