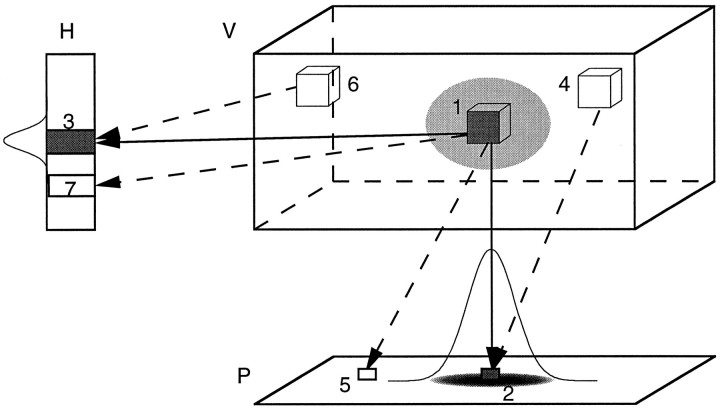
Fig. 8.
Binding of sensory features to charts. This figure illustrates the learning rules of the model. Each P unit is virtually connected to any V unit, and the list of nonzero connections is stored in each P unit, and similarly for the H units. There is a limit of connections per unit in each array. Given the activity distribution in V centered at the unit 1, the activity packet in P centered at the unit 2, and the activity packet in H centered at the unit 3, the connections 1–2 and 1–3 can be potentiated (i.e., added to the list) with some probability. At the same time, connections 1–5, 4–2, 1–7, and 6–3 can be depressed (i.e., deleted from the list).

