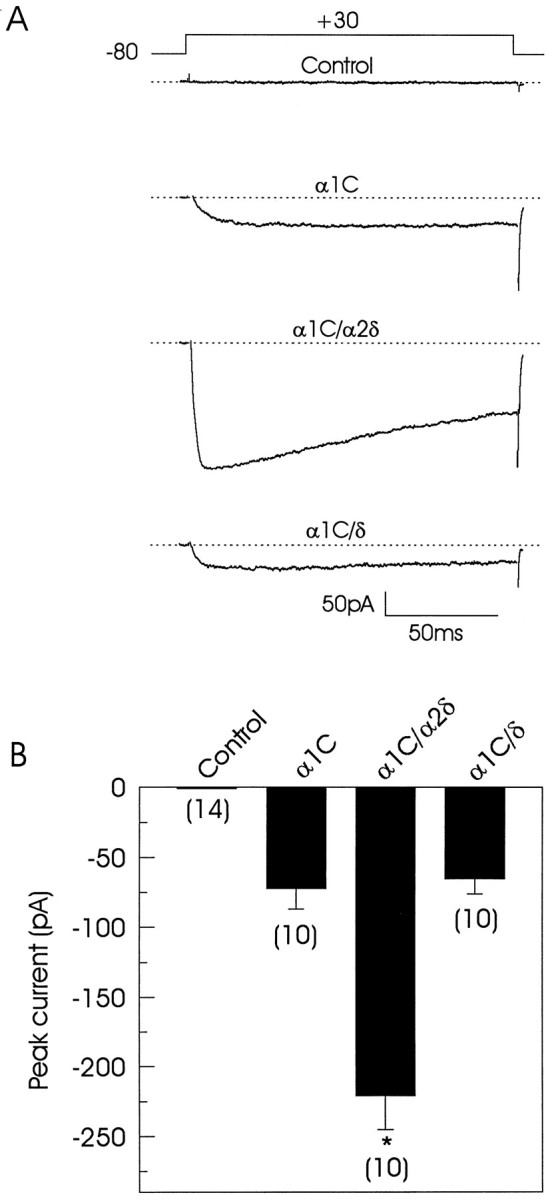
Fig. 1.

Whole-cell currents in tsA201 transiently transfected cells. A, Ba2+ currents induced by activating pulses in four different representative cells.Top trace corresponds to the current recorded in a control (untransfected) cell. Lower traces correspond to current records that were obtained in cells transfected with Ca2+ channel subunits in various combinations. The voltage protocol is shown above the traces, and thedotted line represents the baseline current.B, Comparison of peak current amplitudes at +30 mV in control and transfected cells. Data are expressed as mean ± SE, and the number of recorded cells is indicated inparentheses. Statistical significance of the difference between singly transfected and cotransfected cells was determined by Student’s t test (*p < 0.05).
