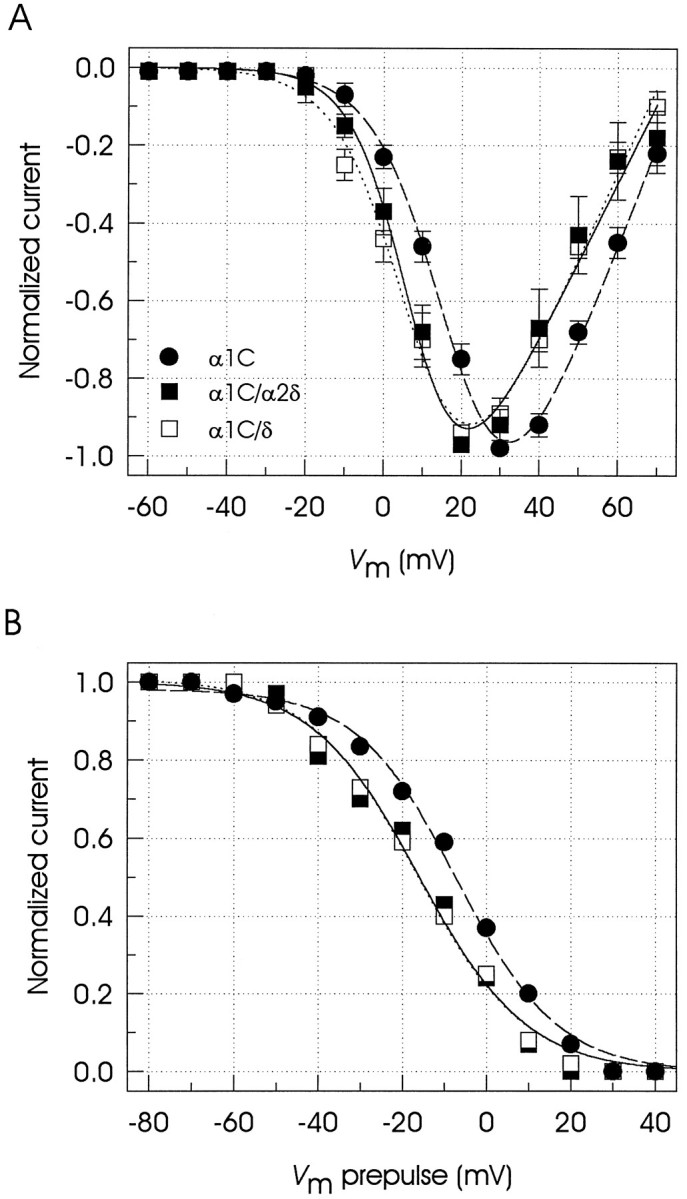
Fig. 2.

Voltage dependence of the currents through expressed Ca2+ channels. A, Plot of peak normalized current–voltage relationships in transiently transfected cells. Currents were recorded in response to 150 msec depolarizations from a holding potential of −80 mV with a 10 mV increase in the pulse amplitude per step. Symbolsrepresent mean ± SE values of five to eight cells in each condition. Fits of the I–V curves were obtained assuming an activation curve of a Boltzmann type:IBa = [g(Vm −Vrev)]/(1 + exp[−(Vm −V1/2)/s]), whereg is the conductance, Vmrepresents the test potential, Vrev is the apparent reversal potential, and s is the range of potential for an e-fold change aroundV1/2. B, Measurement of the voltage dependence of inactivation at steady state. The graph shows peak currents at +30 mV as a function of the prepulse potential for three different cells (α1C, •; α1C/α2δ, ▪; α1C/δ, □). A series of 13 different 1.2 sec prepulse potentials from −80 to +40 mV was applied first, and the inactivated currents were measured with 50 msec test pulses. The obtained inactivation curves were fit with a Boltzmann function of the form: IBa =Imax/(1 + exp[(Vm −V1/2)/s]), where the current amplitude IBa has decreased to a half-amplitude at V1/2 with ane-fold change over s mV. Pertinent parameters of the fits are given in Table 1.
