
Fig. 3.
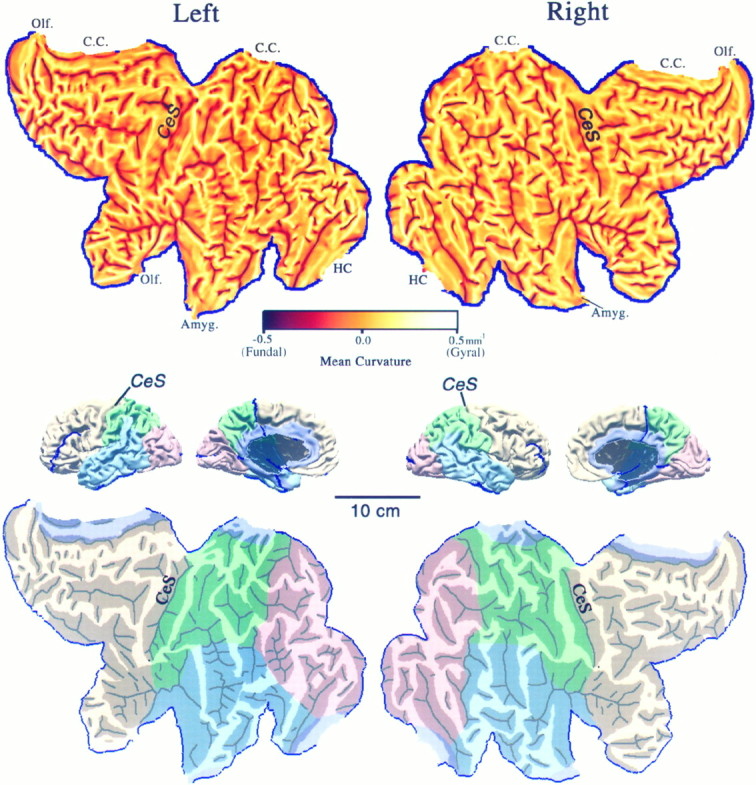
Flat maps of the left and right cerebral hemispheres. Top panels show flat maps with mean curvature displayed to represent cortical geography. Each map was aligned by making the mean orientation of the fundus of the central sulcus on the flat map match the visually estimated average orientation of the lips of the central sulcus in the 3-D reconstruction. For a region that is folded but not intrinsically curved, a mean curvature of ±0.5 mm−1 (maximum on the scale) is equivalent to a cylinder of 1 mm radius. Middle panels show medial and lateral views of the intact hemispheres, with lobes identified according to landmarks delineated by Ono et al. (1990) and suitably colored (occipital lobe in pink, parietal lobe ingreen, temporal lobe in blue, frontal lobe in beige, and limbic lobe inlavender). C.C., Corpus callosum;HC, hippocampus; Amyg., amygdala; andOlf., olfactory cortex. Bottom panelsshow the same flat maps with lobes colored and with darker shading applied to all regions of buried cortex, i.e., cortex not externally visible in the intact hemisphere, as determined from the original image slices (compare Fig. 1) and from the 3-D surface and volume reconstructions. Black lines indicate sharply creased regions (fundi) within each sulcus that were traced manually on the curvature maps. The scale applies to all panels. Artificial cuts (blue lines) were introduced to reduce distortion in the flat maps.