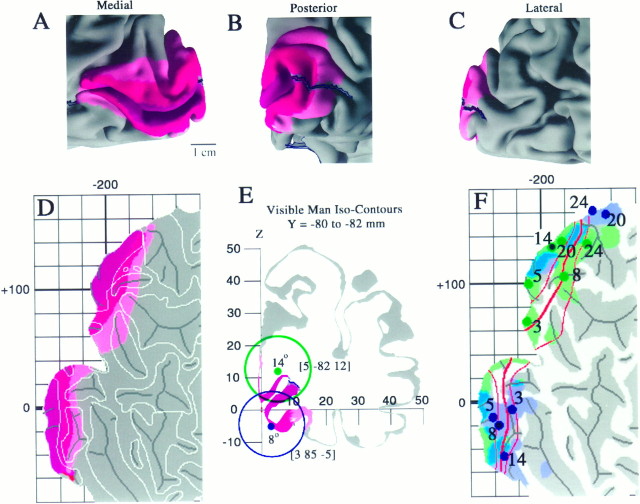
Fig. 9.
Estimated location and variability in extent of visual area V1 in the Visible Man. A–C, Medial, posterior, and lateral views of V1 determined from the postmortem architectonic study of Rademacher et al. (1993). Maroonregions represent cortex that belongs to V1 in all or nearly all of the 20 hemispheres illustrated by Rademacher et al. (1993) in a series of medial and lateral drawings of each hemisphere.Red regions incorporate an additional belt of cortex that is part of V1 in about half of the hemispheres.Pink includes cortex that is part of V1 in a minority of cases, based on estimated distances from the margins of the calcarine sulcus and other geographical landmarks. D, The same inner, most likely, and outer border estimates for V1 are shown on a cortical flat map of the occipital lobe in relation to gyral and sulcal outlines. E, Two foci along the V1/V2 boundary taken from the fMRI mapping study of DeYoe et al. (1996) are shown in relation to a coronal slice through the Visible Man. The blue dot represents 8° eccentricity along the superior vertical meridian, and the blue ring indicates the 10 mm uncertainty zone surrounding this stereotaxic location. Similarly, thegreen dot and ring represent 14° along the inferior vertical meridian. F, Projection of activation foci and associated 10 mm uncertainty zones for five eccentricities along the superior vertical meridian (blue dots and shading) and five eccentricities along the inferior vertical meridian (green dots andshading). Blue-green represents portions of the surface within 10 mm of both types of focus.

