
Fig. 11.
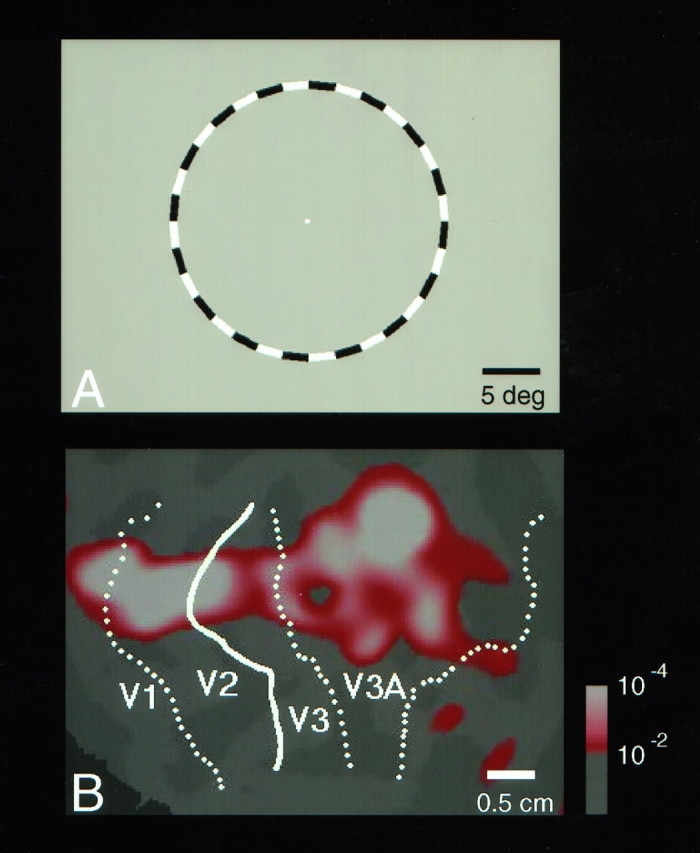
Measurements of the cortical point spread of activity, measured here from stationary stimuli, also show a relatively expanded representation in V3A. Subjects fixated on a central dot throughout this experiment, as shown in the experimental stimulus in A. In each 16 sec experimental epoch the contrast of the black and white checks in the isoeccentric ring alternated in counterphase (3 Hz). The ring had a radius of 12.3° (midpoint) and a width of 0.6° (see calibration bar inA). In alternating 16 sec control epochs, the stimulus in A was replaced by a uniform gray field.B, The differential activation map produced by this stimulus comparison (red through white; see pseudocolor scale bar for significance values) is shown in superior occipital cortex. Also shown are the visual area borders extracted from the retinotopic field sign maps asdotted and solid lines. The activation produced by this ring extended further in V3A, as compared with V3, V2, orV1, over a range of significance values.V3A includes twice the polar angle representation, as compared with the quarter-field representations of V1,V2, and V3 shown here; thus one would expect its representation along that continuum (left to right in B) to be expanded correspondingly. However, the ring representation in V3A also is expanded along the eccentricity dimension (up–down inB). The latter likely reflects an increase in receptive field size in V3A relative to V1–V3, as suggested in the time course data of Figure 10.