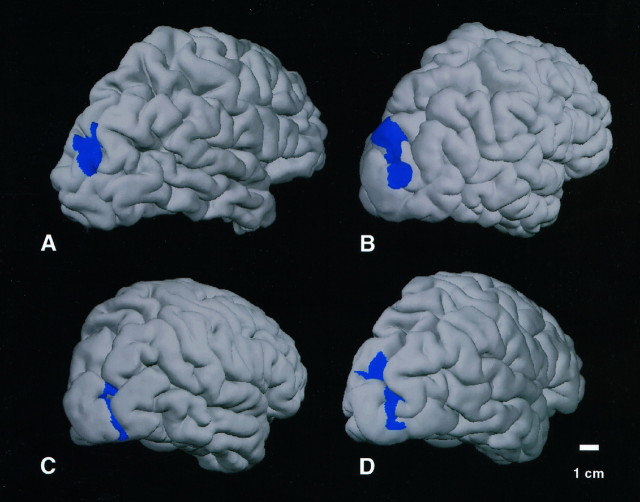
Fig. 8.
Variation in the topography of V3A across individuals. The extent of activated V3A is rendered inblue, based on field sign data from the same hemispheres, in four representative cases. Data are rendered on folded-format right-sided cortical surfaces, seen from a posterior lateral viewpoint. Although some variability exists, V3A always extends over the lateral surface, elongated along the superior–inferior axis, ∼3–5 cm from the occipital pole. The calibration bar accurately reflects distances across the cortical surface, excepting perspective foreshortening.

