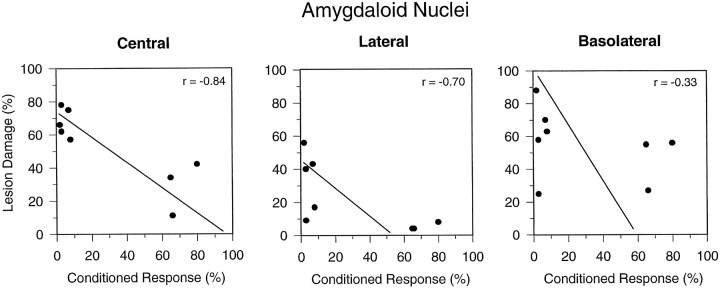
Fig. 3.
Scatter plots of the percentage of conditioned response and the percentage of lesion-induced brain damage in the central, lateral, and basolateral amygdalar nuclei of the rabbits with lesions. The regression line represents the prediction ofy (conditioned responses) from x (brain damage). The corresponding Pearson product–moment correlations are shown in the top right corner of each plot.PT, pretraining; FE, first exposure to conditioning; FS, first significant discrimination;CRIT, criterion attainment.

