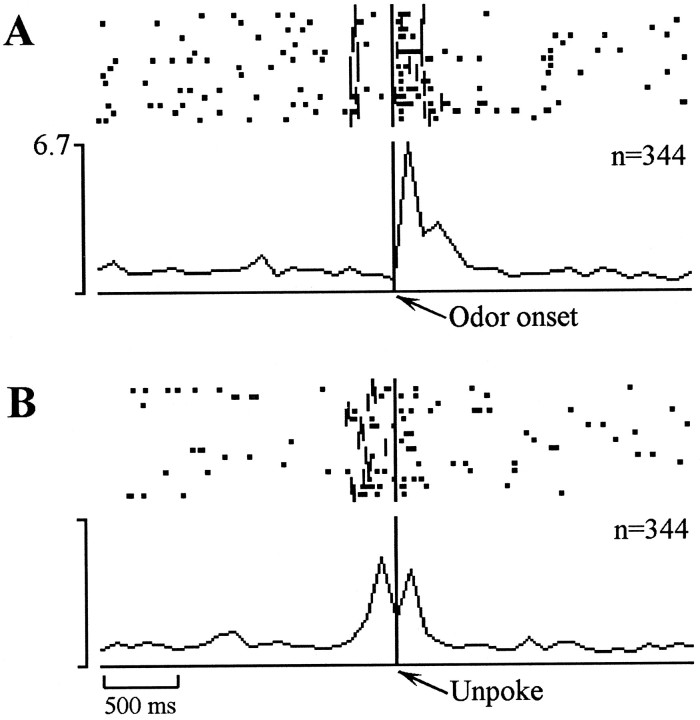
Fig. 3.
Example of a perirhinal cue-sampling cell that showed a rapid increase in activity after the odor onset (A) and then a decrease in activity that was less sharply time-locked to the unpoke (B).Vertical tic marks to the left andright of the synchronization point indicate the occurrence of a poke and an unpoke respectively (A); tic marks to theleft of the synchronization point indicate the occurrence of the odor onset (B).

