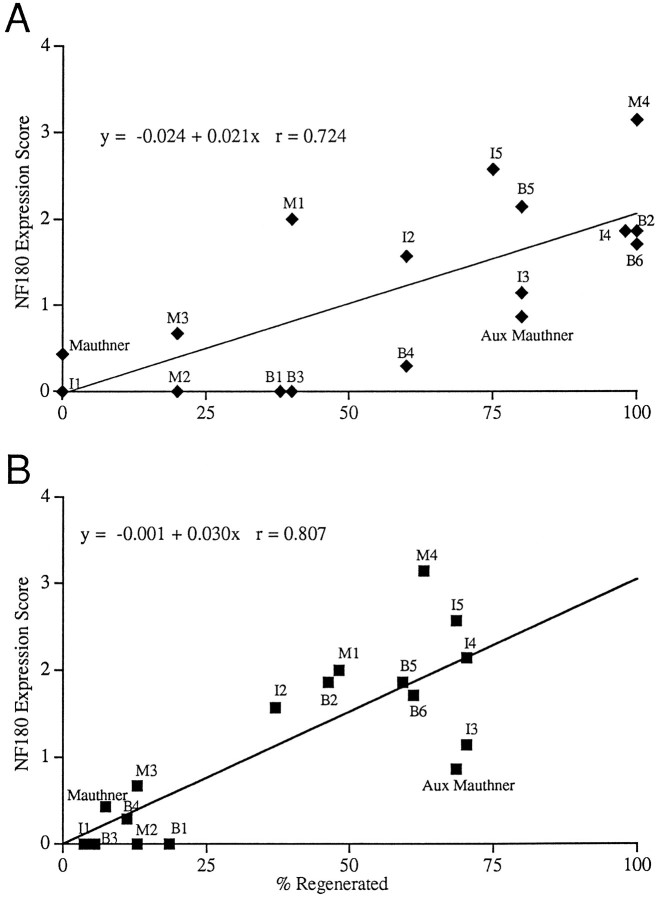
Fig. 9.
Correlation between NF-180 expression score at 10 weeks and the probability of axonal regeneration in identified reticulospinal neurons. A, For each of 17 identified neurons in five hemisected animals, the mean expression score at 10 weeks is plotted against the probability of axonal regeneration across the lesion for that neuron, as measured in five additional hemisected animals permitted to recover 10 weeks (⧫). The name of each reticulospinal neuron is shown adjacent to its data point. Theline represents the best fit linear regression,r = 0.72. B, The same regression but using the probability of regeneration determined in the 27 completely transected animals of Table 2 (▪) (r = 0.81).

