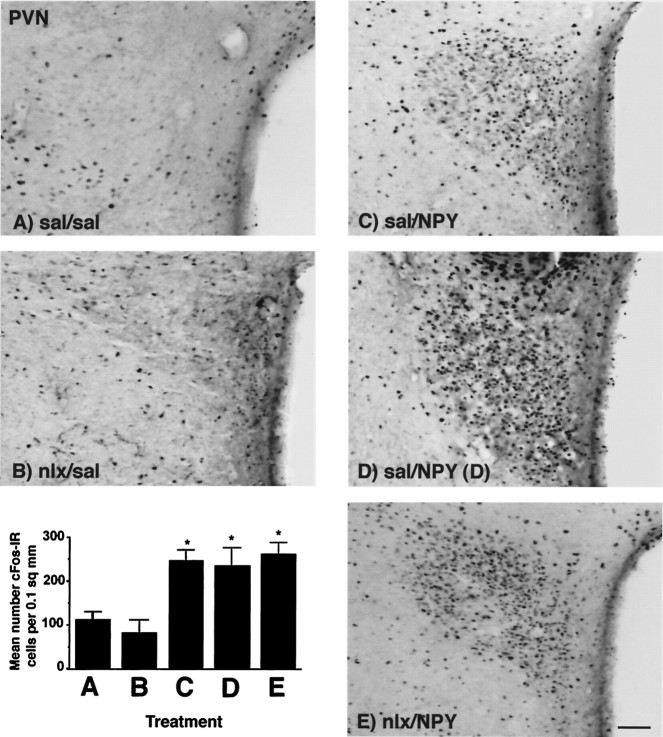
Fig. 1.
Photomicrographs showing cFos-IR in the PVN in response to peripheral injection of either 0.9% saline or 1 mg/kg naloxone, followed 30 min later by PVN injection of either 0.9% saline or 1 μg NPY. cFos-IR was significantly increased by PVN injection of NPY and was not affected by feeding or by blockade of NPY-induced feeding attributable to naloxone injection. Treatments abbreviated as per Table 1. A–E on photomicrographs correspond toA–E on graph. Graph represents treatment means; error bars represent SEM. *Significant fromsal/sal group. Magnification, 25×. Scale bar, 200 μm.

