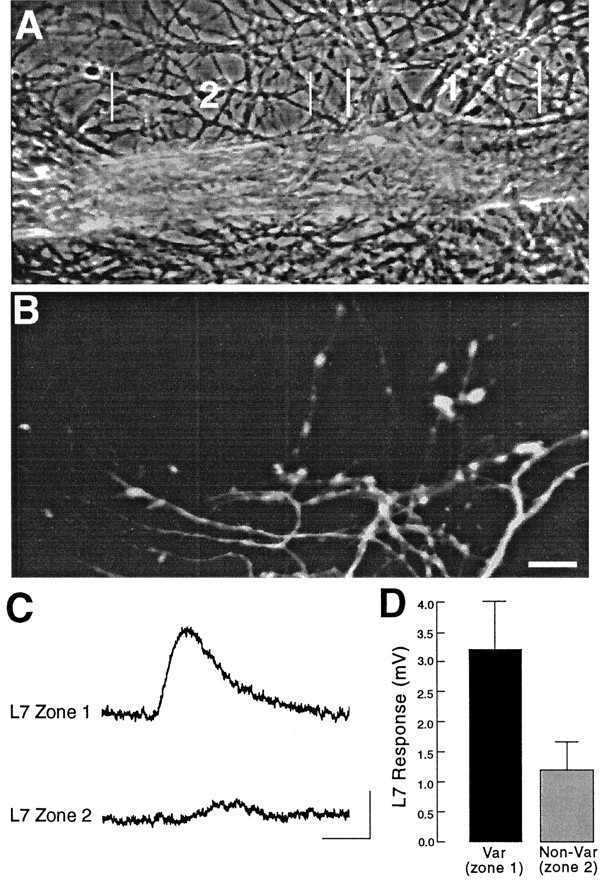
Fig. 3.

Local glutamate response is enhanced by the presence of SN varicosities. A, Phase-contrast micrograph of portion of L7 axon 250–400 μm from the L7 cell body (located to the left of this region). Zone2 is closer to the L7 cell body. B, Epifluorescent view of SN neurites and varicosities in the same region as in A. Note that the more distal zone 1has more SN varicosities in contact with L7’s axon (10 varicosities) than SN varicosities in contact with the more proximal portion of the axon in zone 2 (two varicosities). Scale bar, 15 μm.C, Response to glutamate (250 μm for 100 msec) applied to zones 1 and 2, respectively. Calibration: vertical, 2 mV; horizontal, 200 msec.D, Summary of the differential responses evoked by glutamate to adjacent zones along L7’s axon, where one zone has from 2.5- to 5-fold more SN varicosities. On average (n= 7 cultures), there is a 2.7-fold difference in glutamate response (t = 4.126; p < 0.006).
