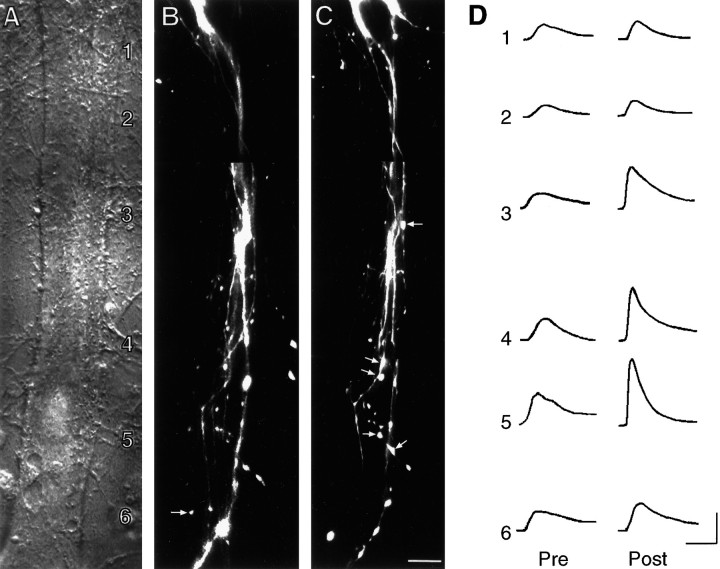
Fig. 4.
Long-term facilitation of SN–L7 synapses with 5-HT is accompanied by an increase in glutamate response at zones with preexisting and new SN varicosities. A, Nomarski contrast image of proximal 300–350 μm portion of L7’s axon. L7 cell body is just out of view at bottom. The numbers indicate the location of the sites of glutamate applications (1000 μm with 10- to 15-μm-wide stream lasting 100 msec) both before and after treatment. The fine neurites of L7 extending adjacent to the axon are unchanged over the 24 hr period and were used to relocate the zones for the second recording. Scale bar, 15 μm. B, C, Epifluorescent view of all SN neurites and varicosities (superimposition of three focal planes) in the same area as in A interacting with L7 axons before (B) and 24 hr after (C) treatment with 5-HT. EPSP amplitude increased from 18 mV on day 4 to 30 mV on day 5. The arrows in B point to varicosities that are no longer present on day 5. Thearrows in C point to some of the new varicosities. Overall, there was a net change of 10 varicosities.D, Response to glutamate in each zone (zones1–6) before (Pre) and 24 hr after (Post) treatment with 5-HT. Note that the largest increases in glutamate response are in zones with preexisting or new SN varicosities (zones 3–5). Although the rate of rise for the individual responses in this preparation before treatment was somewhat slower than average, there were no overall differences between the control and 5-HT groups before treatment (see Results). The responses for the control cell illustrated in Figure 5 were obtained on the same day as those illustrated here with the same set of pipettes at each time point. Another zone distal to this region was not included. No change in response was observed in the most distal site along the L7 axon that had no SN varicosities. Calibration: vertical, 5 mV; horizontal, 200 msec.

