Fig. 5.
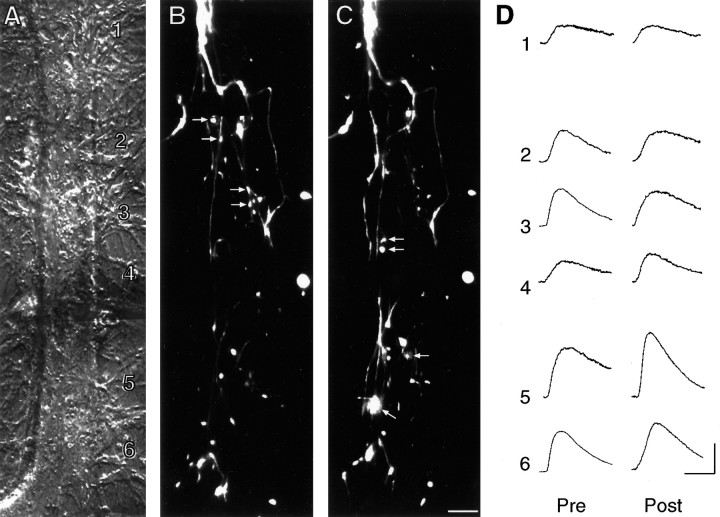
SN structure and glutamate responses before and after control treatment. A, Nomarski contrast view of proximal 300–350 μm portion of L7’s axon. L7 cell body is just out of view at bottom. The numbers indicate the zones of glutamate applications (1000 μm with 10- to 15-μm-wide streams lasting 100 msec) both before and after treatment. A more distal zone is not shown. Scale bar, 15 μm. B,C, Epifluorescent view of SN neurites and varicosities (superimposition of up to three focal planes) in the same area as inA interacting with L7 axon before (B) and 24 hr after (C) control treatment. EPSP amplitude changed from 20 mV on day 4 to 22 mV on day 5. The arrows in B point to some of the varicosities that are no longer present on day 5. Thearrows in C point to some of the new varicosities. There was an overall net change of two SN varicosities contacting this portion of the L7 axon. D, Response to glutamate in each zone (zones 1–6) before (Pre) and 24 hr after (Post) control treatment. Note little significant change in the amplitude or rate of rise of the responses to glutamate. Calibration: vertical, 5 mV; horizontal, 200 msec.

