
Fig. 6.
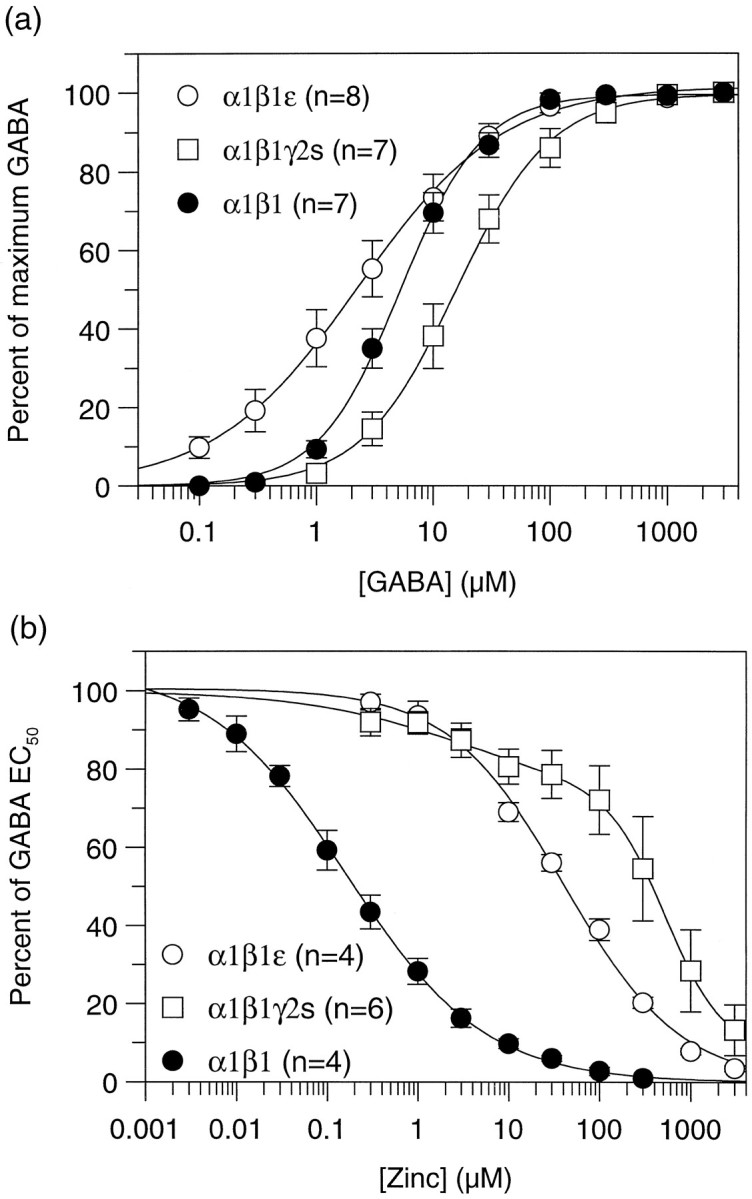
Functional expression of receptors containing the ε subunit. a, Concentration–response curves to GABA of α1β1, α1β1γ2s, andα1β1ε GABAA receptors expressed inXenopus oocytes. b, Concentration–response curves for inhibition of an EC50concentration of GABA by increasing concentrations of zinc. Data represent mean curves from the number of cells indicated for each subtype. Curves were fit as described in Materials and Methods, with the exception of α1β1γ2s, which was best fit with two components of inhibition.