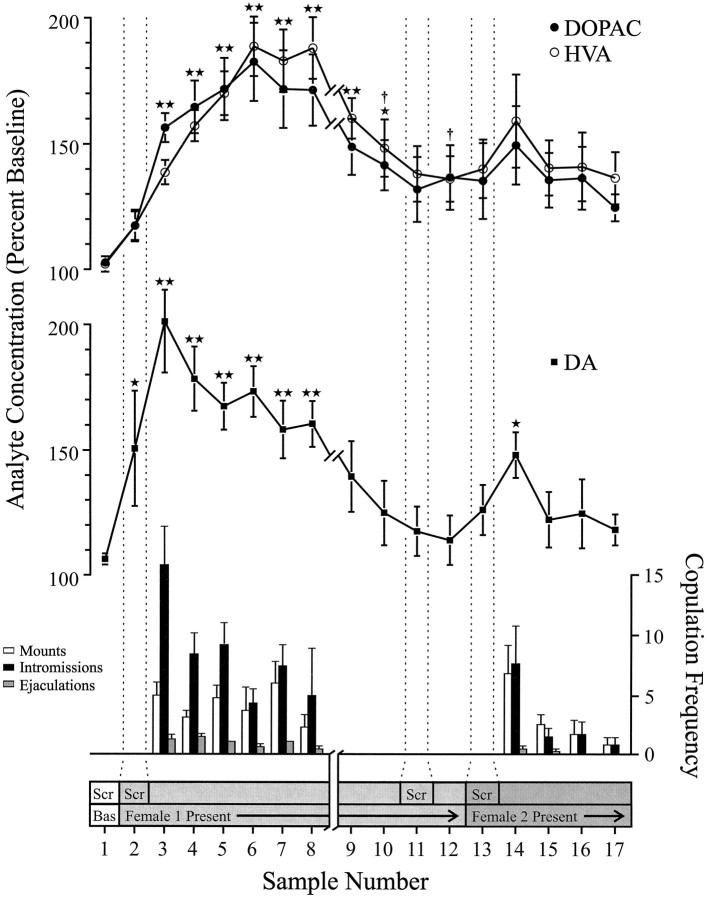
Fig. 1.
Nucleus accumbens neurochemical correlates of sexual behavior during the Coolidge effect. The first eight samples represent chronologically continuous data points from phases 1 to 3. Sample 1 is the fourth and last precopulation baseline samples (Bas). Sample 2 represents introduction of female 1 behind the screen (Scr). After 15 min, the screen was removed, and rats were allowed to copulate (samples 3–8). Thebreak on the x-axis corresponds to the exclusion of data from three rats that copulated for extended periods with the initial female. The last nine samples were also continuous chronologically. Samples 9 and 10 correspond to the satiation period of phase 3 (i.e., 30 min without a mount). Female 1 was then reinserted behind the screen (sample 11) and, 15 min later, the screen was removed (sample 12). After 15 min devoid of copulation, female 2 was placed behind the screen (sample 13). Samples 14–17 correspond to copulation with female 2. The number of mounts, intromissions, or ejaculations associated with each 15 min microdialysis sample are shown in the bottom bar graph. Neurochemical data are expressed in terms of percentage of baseline concentrations. Changes in NAC DA (closed squares), DOPAC (closed circles), and HVA (open circles) efflux are presented as line graphs. The following comparisons were made: baseline sample 1 versus samples 2–10; new baseline sample 10 versus samples 11 and 12; new baseline sample 12 versus samples 13–17 (*p < 0.05; ** p < 0.01). Independent t tests were made between baseline values (samples 1, 10, and 12). For significant differences from the first baseline (sample 1), †p < 0.05.

