Fig. 6.
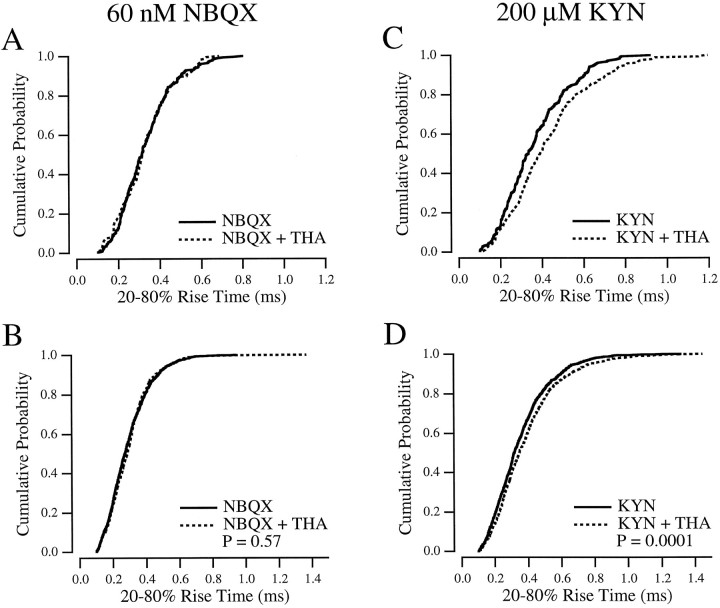
THA slows the mEPSC rise in the presence of KYN.A, Cumulative probability histogram of mEPSC rise times from a single cell in 60 nm NBQX (solid line) and NBQX plus 300 μm THA (dotted line). B, mEPSC rise times from five cells, combined, in NBQX alone (solid line;n = 1094) and in NBQX and THA (dotted line; n = 890). C, Cumulative probability histogram of mEPSC rise times from the same cell as in A in 200 μm KYN (solid line) and KYN plus 300 μm THA (dotted line). D, mEPSCs from the same six cells as inB, combined, in KYN alone (solid line;n = 1158) and in KYN and THA (dotted line; n = 1059).

