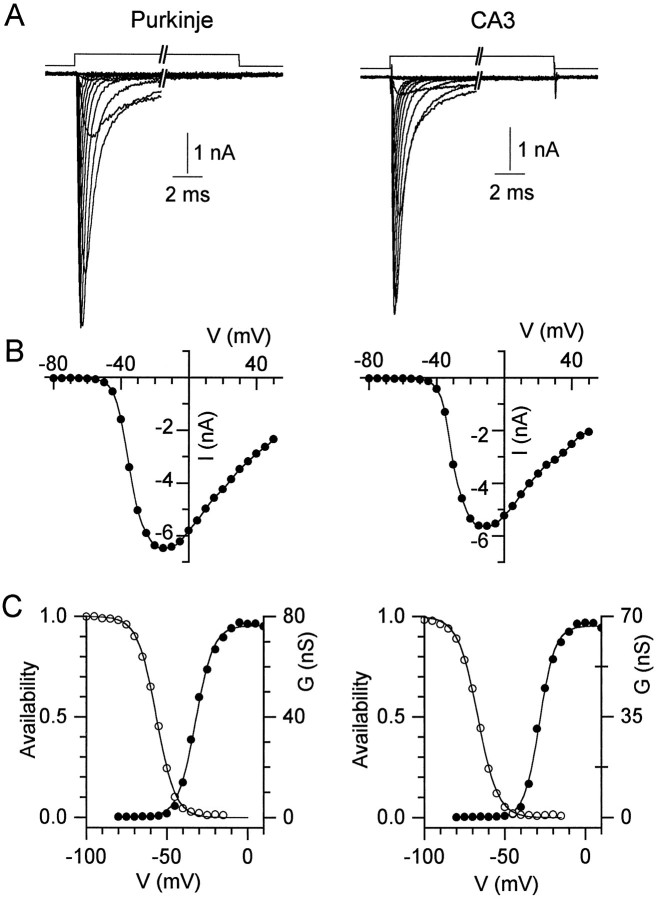
Fig. 1.
Transient sodium currents in Purkinje and CA3 neurons. A, Currents evoked from a holding potential of −90 mV by 50 msec steps to potentials between −80 and +50 mV in 10 mV increments are shown for a Purkinje cell (left) and a CA3 cell (right). The break in the trace represents 39 msec. B, Current–voltage relation for the peak currents in A. The points are connected by a spline function for clarity. C, Peak conductance (filled circles) and steady-state inactivation curves (open circles) for the cells shown in A. Conductance curves were fitted (lines) with the Boltzmann function,G = Gmax/(1 + exp[−(V −Vh)/k]), where G is conductance in nanosiemens, Gmax is the maximal conductance, V is the step potential in mV,Vh is the voltage for half-maximal activation in mV, and k is the slope factor in mV. The fitted Gmax, Vh, and k for the Purkinje neuron were 76.4 nS, −32.3 mV, and 5.5 mV, and for the CA3 neuron 66.7 nS, −28.4 mV, and 4.8 mV. The inactivation curves were fitted by the Boltzmann function 1/(1 + exp(V −Vh)/k).Vh and k values were −56.5 and 5.8 mV for the Purkinje cell (left), and −67 and 6.2 mV for the CA3 cell (right).

