
Fig. 1.
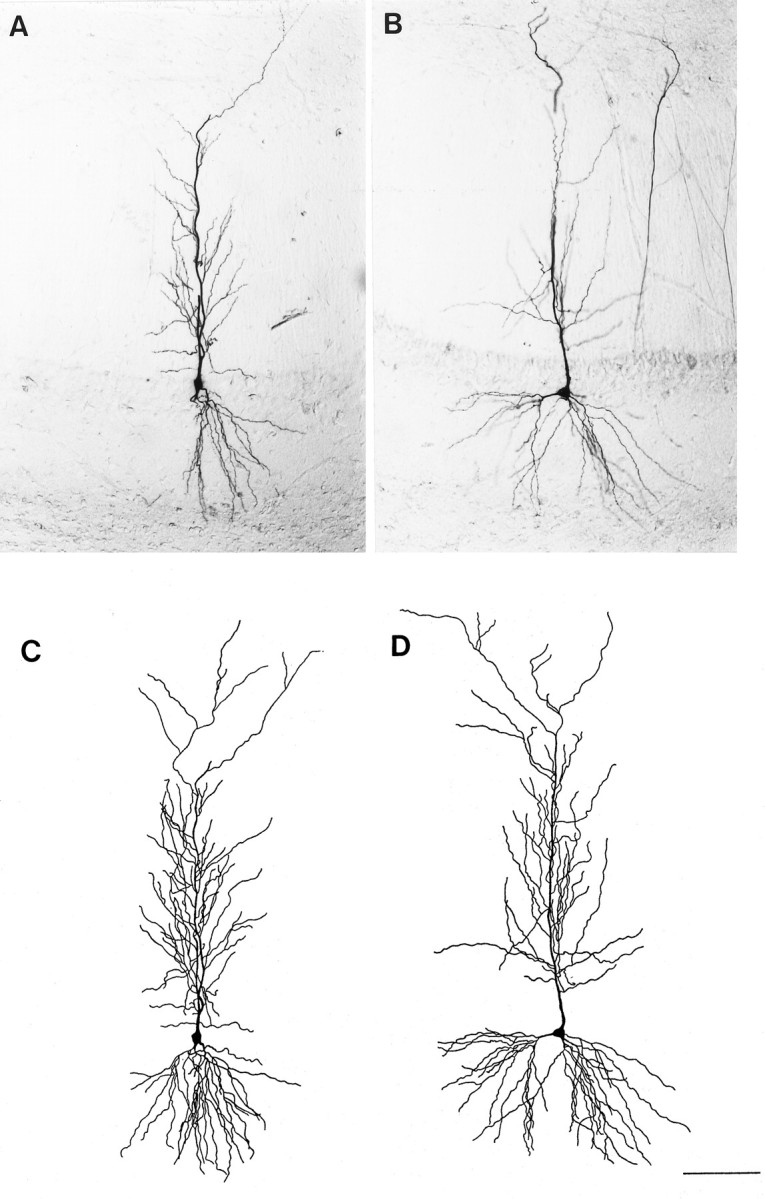
Photomicrographs of single sections containing a representative biocytin-filled CA1 pyramidal cell from an OVX+O (A) and an OVX+E (B) animal. Camera lucida tracings of the cell body and complete dendritic tree reconstructed from all sections containing the same cells from the OVX+O (C) or OVX+E (D) animal are shown in thelower panels. Camera lucida tracings were used to determine total dendritic length of each cell; no differences in total dendritic length were observed between treatment groups. Scale bar, 50 μm (applies to all panels).