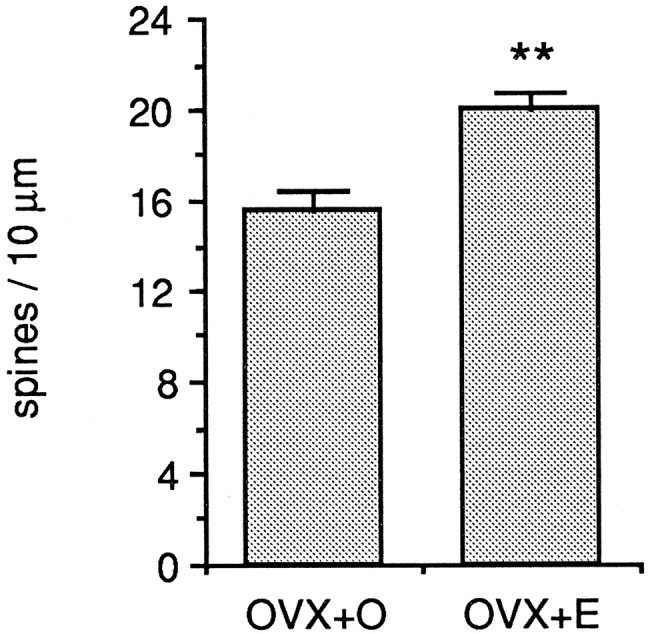
Fig. 3.

Bar graphs depicting the mean difference in dendritic spine density in the apical dendritic trees of CA1 pyramidal cells from ovariectomized, oil-treated (OVX+O), and ovariectomized, estradiol-treated (OVX+E) animals. All well filled CA1 pyramidal cells in this study were included. The difference in mean dendritic spine density is 22%; **p < 0.001.
