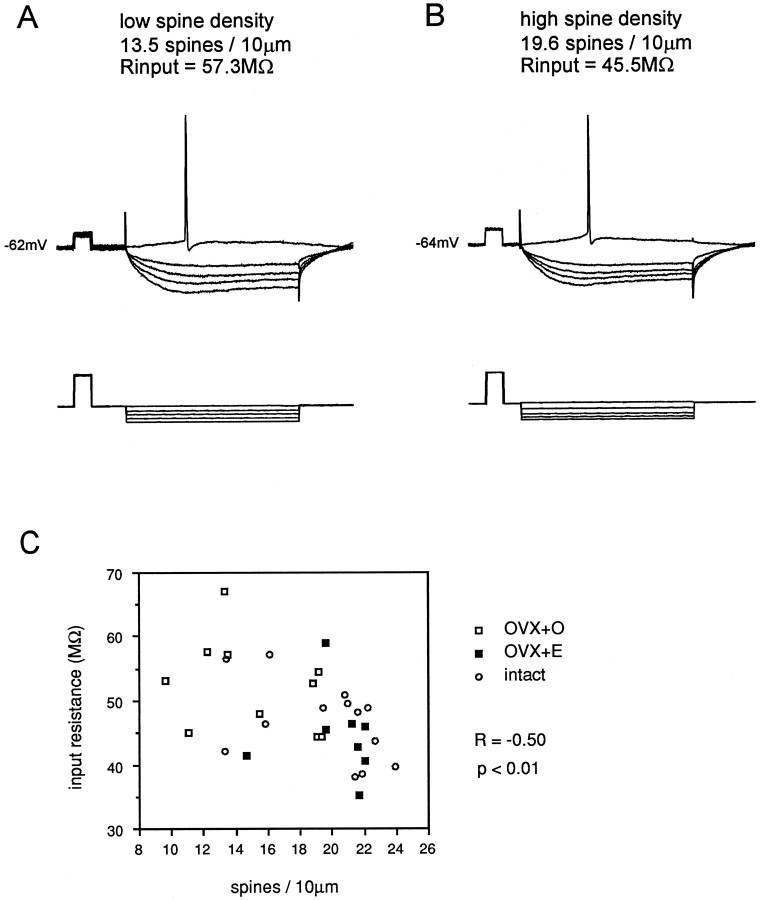
Fig. 4.
Representative intracellular recordings from CA1 pyramidal cells in slices from an OVX+O (A) and OVX+E (B) animal. Recordings were made from the resting membrane potential in standard ACSF. In each panel, the top tracesare voltage and the bottom traces are current. Calibration pulse, 10 mV, 10 msec. Note that input resistance is greater in the cell in A (OVX+O), which has a lower density of dendritic spines than the cell in B (OVX+E), which has higher spine density. C shows the negative correlation between input resistance and dendritic spine density in CA1 pyramidal cells. Data from cells in OVX+O (open squares), OVX+E (filled squares), and gonadally intact (open circles) animals are plotted together. Although there is a significant correlation between spine density and input resistance, there is no significant difference in mean input resistance between cells from OVX+O and OVX+E animals (see text).

