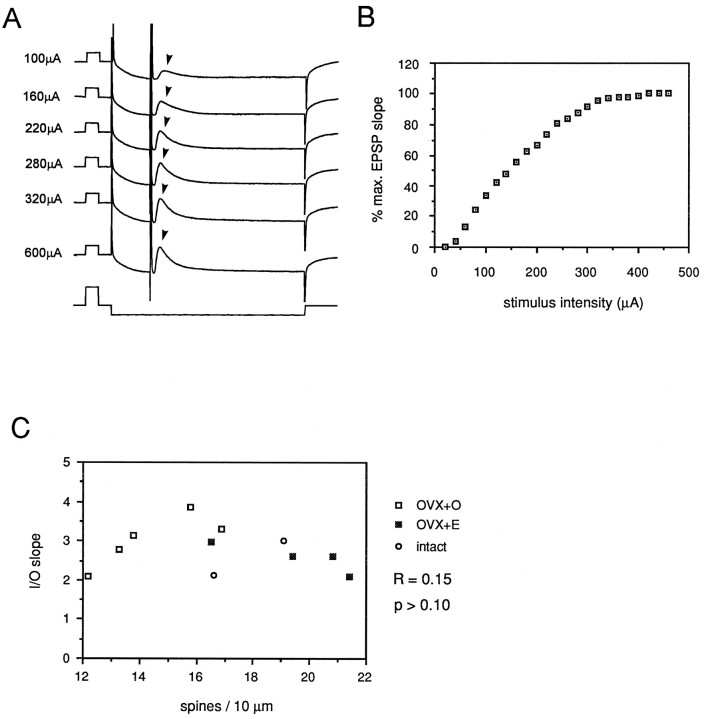
Fig. 7.
A shows representative intracellular recordings from a CA1 pyramidal cell recorded in standard ACSF. Calibration pulses in top (voltage) tracesindicate 10 mV, 10 msec, in bottom (current)trace 1.0 nA, 10 msec. Stimuli of increasing intensity (indicated at the left of each trace) were delivered to the CA1 st. radiatum embedded in a 100 msec, 0.5 nA hyperpolarizing current pulse. EPSP (indicated by arrowheads in A) slope was plotted versus stimulus intensity to generate input/output curves (B). The slope of such intracellular input/output curves was taken as a measure of sensitivity to synaptic input. No correlation between input/output curve slope and dendritic spine density was observed under standard recording conditions (C).

