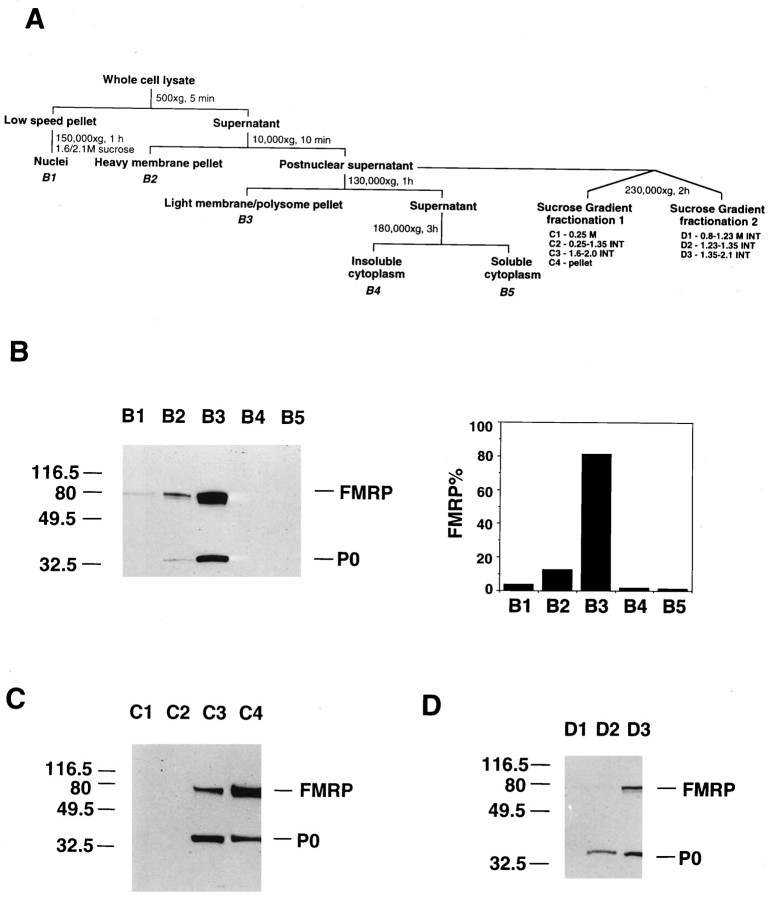
Fig. 1.
FMRP distribution in subcellular fractions of human lymphoblastoid cells. A is a schematic illustration of subcellular fractionation of EBV-transformed human lymphoblastoid cells. The descriptor under key fractions refers to the panels below(B–D), with INT as interface. A detailed description and protocol is provided in Materials and Methods. InB, the left panel shows SDS-PAGE immunoblot analysis of FMRP and P0 in crude subcellular fractions. Total protein (3 μg) from each fraction of B1–B5 was loaded. Densitometric analysis of immunoblot signals was used to calculate the total yield of FMRP in each corresponding fraction, based on the total fraction volume. The relative percentage of FMRP in each fraction was plotted as shown in the right panel. Cshows the SDS-PAGE immunoblot analysis of FMRP and P0 in separated postnuclear supernatant fraction. C1–C4 in sucrose gradient fractionation 1 represent cytosol; low-density membranes (plasma membrane, Golgi, and smooth ER); high-density membranes (RER); and free polysome pellet, respectively. Total protein (1.5 μg) from each fraction was loaded. D shows the SDS-PAGE immunoblot analysis of FMRP and P0 in various ER components.D1–D3 in sucrose gradient fractionation 2 represent smooth ER, light RER, and heavy RER. Total protein (3 μg) from each fraction was loaded.

