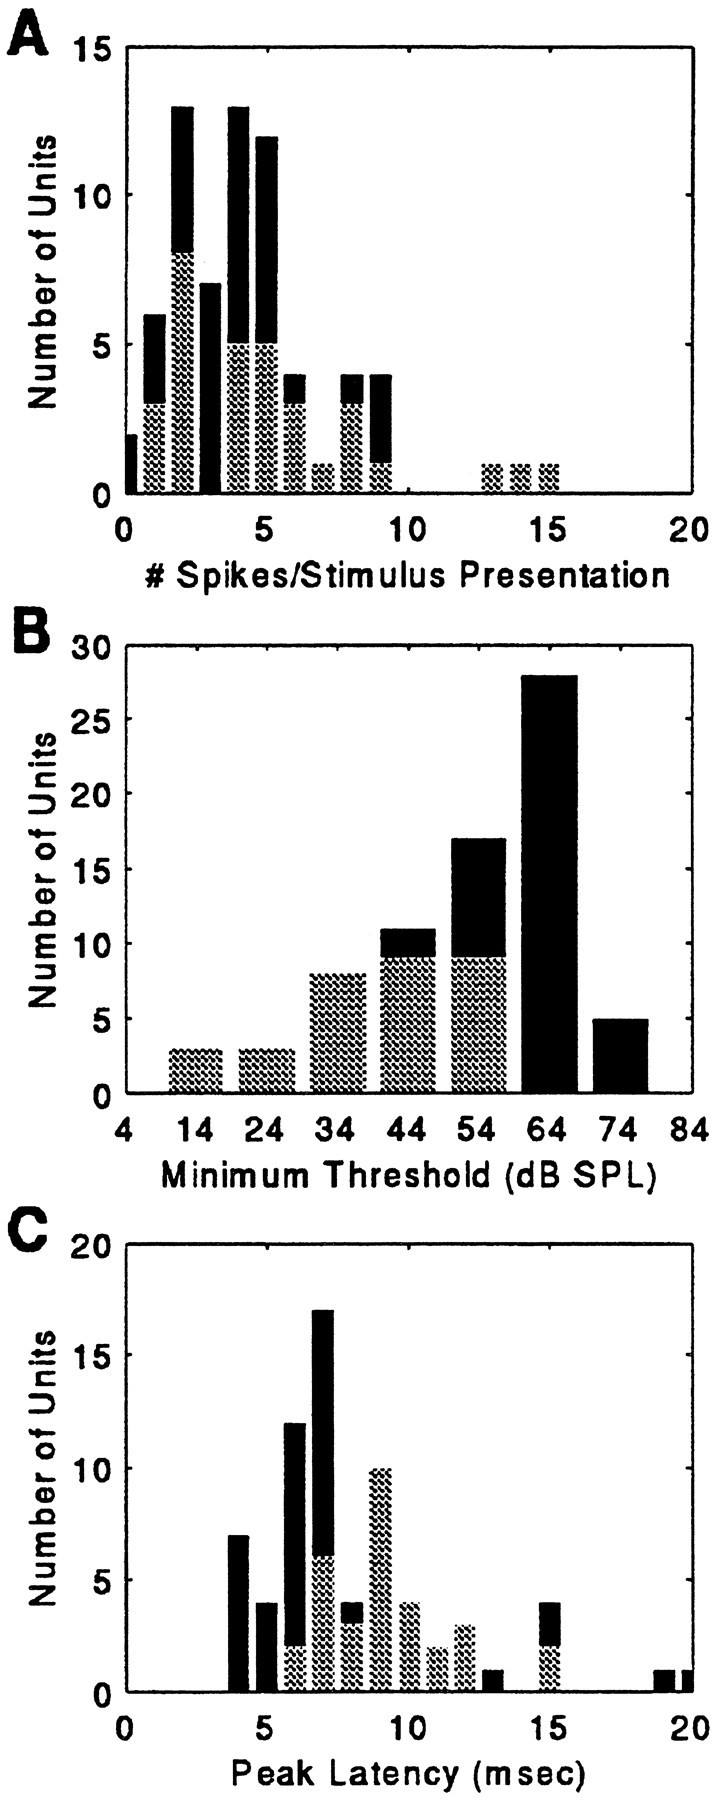
Fig. 12.

Histogram distribution of the average discharge (A), the distribution of minimum thresholds (B), and the distribution of response latencies (C) for the population of SC neurons (N = 98). Mean discharge and response latency reported here are to an unpaired FM sound, presented singly or as P within a delay-stimulus epoch, and broadcast to the bat from the optimum speaker location at 84 dB SPL. Minimum threshold is the minimum sound level at which 0.08 spikes/stimulus presentation (2 spikes/25 epochs) were recorded. 2D cells are indicated by thelight bars; 3D neurons are shown by the dark bars.
