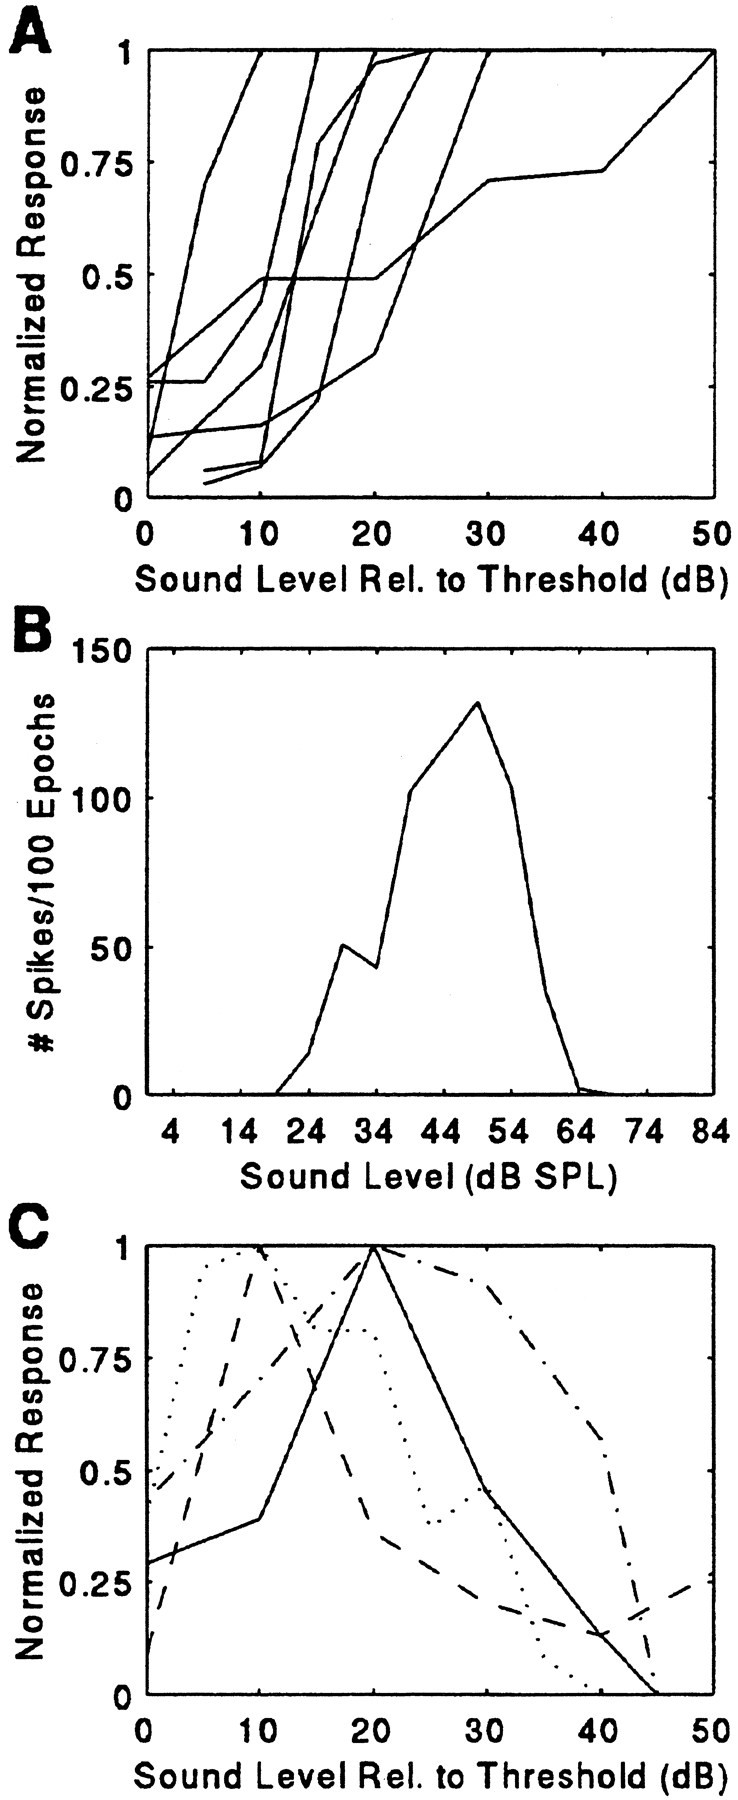
Fig. 13.

Representative rate–intensity curves for 2D (A) and 3D (B, C) neurons.B, Response to a single P stimulus broadcast from 26° contralateral in a 3D neuron. The curve shows a nonmonotonic function; the unit’s response has both an upper and a lower threshold. InA and C, each curve represents a different unit.
