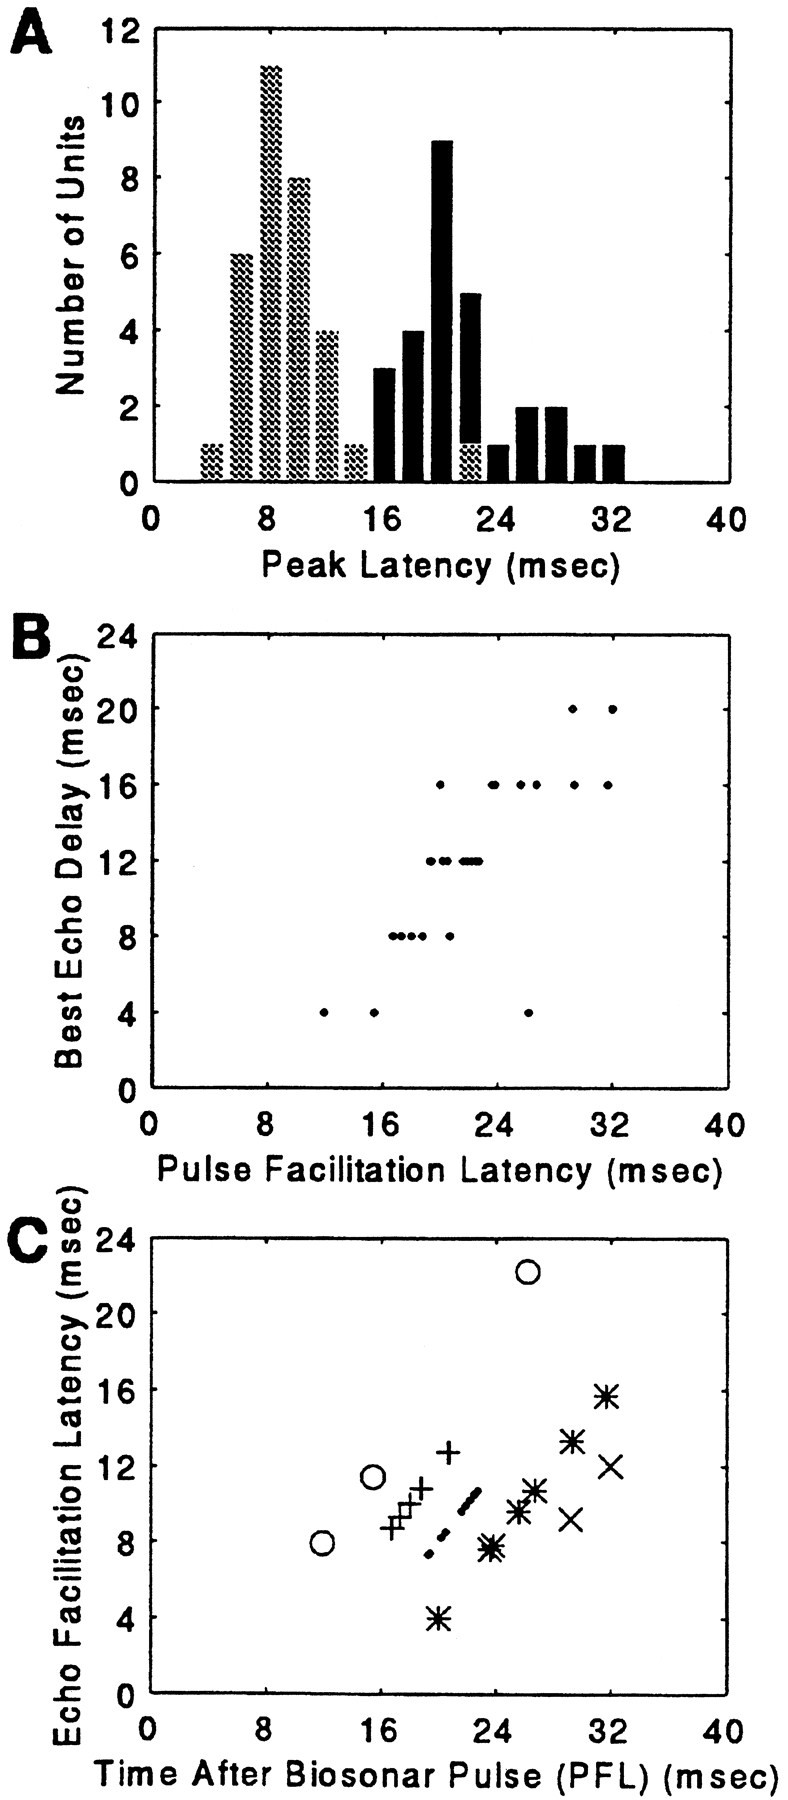
Fig. 15.

A, The distribution of P and E facilitation latencies. The light bars are EFLs, and thedark bars correspond to PFLs. B, PFL at BD for the population of 3D neurons. C, EFL is plotted as a function of PFL. Each symbol indicates the distribution of latencies for the population segregated by BD. ○, 4 msec BD; +, 8 msec BD; ·, 12 msec BD; *, 16 msec BD; ×, 20 msec BD.
