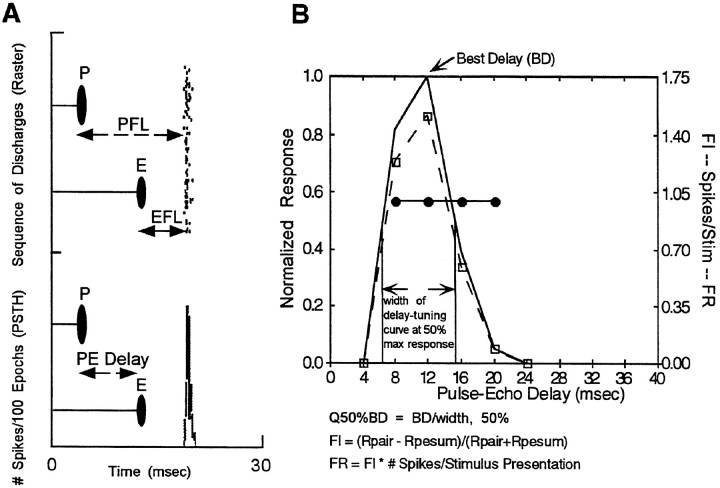
Fig. 3.
Analysis of neuronal response properties.A, Response time analysis. The time to the facilitated response can be expressed with respect to the onset of the first stimulus (PFL) or from the onset of the second stimulus (EFL). B, Analysis of delay facilitation:BD (solid line), Q50%BD(arrows indicate response at 50% of maximum),FI (solid line with circle markers),FR (dash–dot line with square markers) (see Materials and Methods). In this example, BD is 12 msec and FR overlaps with the curve showing the number of spikes/stimulus presentation because FI is 1.0.

