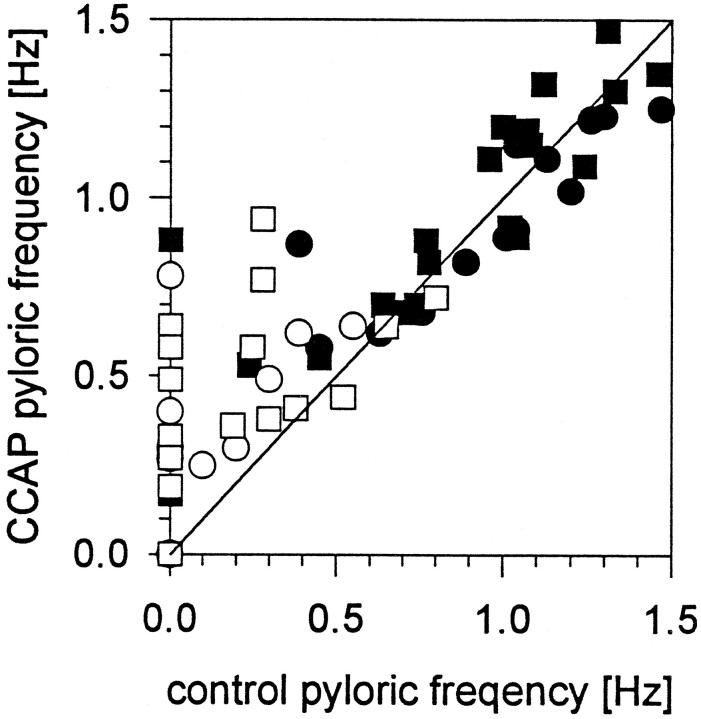
Fig. 3.
Effect of CCAP on pyloric rhythm frequency.X-axis, Frequency in control saline;Y-axis, frequency in CCAP. Points abovethe line are preparations in which the frequency was increased by CCAP. Points below the lineare decreases in frequency. ▪, 10−7m CCAP stn intact; •, 10−6m CCAP stn intact; □, 10−7m CCAP stn cut or blocked; ○, 10−6m CCAP stn cut or blocked.

