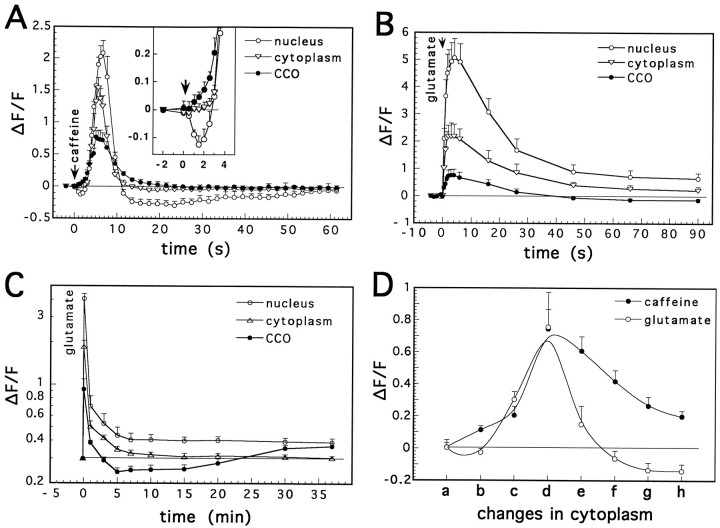
Fig. 6.
Cellular calcium responses to a brief application of caffeine (A) and glutamate (B andC). A, Exposure to a pulse application of caffeine (5 mm, 300 msec pulse, n = 11 cells) caused a transient rise in [Ca]i, which initially started in CCOs (see the insert amplificationof the first part of the graph) and was larger in the nucleus than in cytoplasm or the CCOs, and a slower recovery to baseline in the latter than in former two compartments. B, Glutamate (1 mm, 100 msec pulse) caused a much larger rise in nuclear [Ca]i than caffeine, but a similar [Ca]Crise and an undershoot in the fluorescence of the latter compartment was clear (glutamate, 1 mm, 50 msec pulse,C). D, Detailed comparison between CCO responses to glutamate and caffeine, relative to the changes in cytoplasmic [Ca]i, at successive time points before and after application of the drug: a, before application;b, the last nonsignificant point on cytoplasmic curve after drug application; c, the first significant point in the cytosolic response; d, at the peak of the response; e, one-half recovery to baseline;f, four-fifths recovery; g, last significant point; h, first point of recovery in cytoplasm. A significant rise of [Ca]C in response to caffeine is seen before [Ca]i changes. [Ca]C remained elevated in response to caffeine compared with the response to glutamate and to caffeine in cytoplasm.Ordinate, Ratio of net/baseline fluorescence.Abscissa (in A, B, and C), time; (in D), points in time relative to a defined [Ca]i state. Abscissa of Cis in a logarithmic scale.

